Node Information perspective
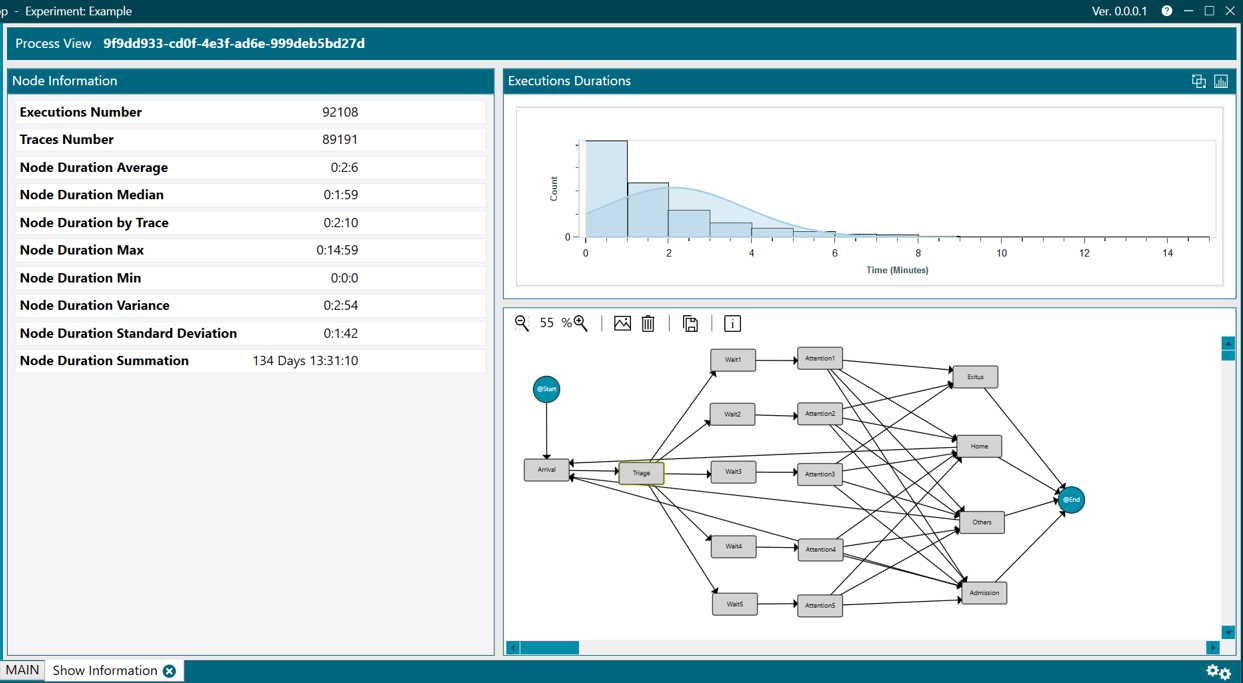
The NODE INFORMATION perspective displays statistics about traces (like the ones shown in the tooltips), a histogram shows the number of trace runs and the time taken for each and the process view where the node selection was made. It is shown in figure 51, with the node highlighted in yellow.

Figure 51. Node information
The meaning of each statistic is the following:
- Executions Number. Number of executions in that node.
- Traces Number. Number of traces that traverse that node.
- Duration Average. Average duration of all executions of that node.
- Duration Median. Median of the duration of all executions of that node.
- Duration by Trace. Time of all the executions of that node divided by number of traces that traverse that node.
- Duration Max. Maximum duration among all executions of that node.
- Duration Min. Minimum duration among all executions of that node.
- Duration Variance. Variance of the duration of time of executions of that node.
- Duration Standard Deviation. Standard deviation of the duration of time of all executions of that node.
- Duration Summation. Summation of all times of all executions of that node.
In the main header of the histogram, there are two options that allow:
-
to compare process views (Compare process views) and
-
to calculate the Gaussian (Calculate gausian mixture)
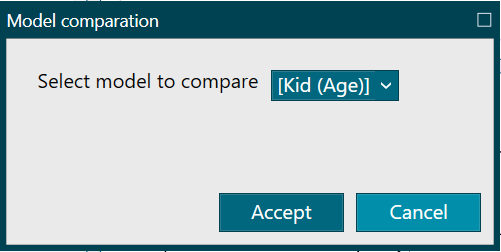
- When you click on option 1, a small text box appears (figure 52) where you have to select the process view against which you want to compare the current process.

Figure 52. Compare process views
- An example would be shown in figure 53, from where the histogram can be restored by clicking the Restore histogram button.

Figure 53. Calculate gausian mixture
- When you click on option 2, a small text box appears (figure 54) where you have to indicate how many gaussians you want to search
Figure 54. Calculate gausian mixture
An example is shown in figure 55, from where the following actions can be carried out:
-
extract the data from the gaussians identified in a new experiment, where a new instance of the PMApp application would open,
-
modify the number of Gaussians displayed,
-
restore the histogram to its original state
In addition, as in the rest of the graphics in the application, if you hover the mouse over the header of the graphic, a menu appears as shown in figure 55

Figure 55. Charts menu
The available options are similar:
- Export as PNG
- Export the data to a CSV file
- Autoscale the chart to fit the available space
Finally, the represented histogram allows:
- To check a specific value represented by the columns or Gaussian, clicking with the left mouse button on the corresponding area,
- holded right click scrolls the graph to the left or right,
- with Ctrl right click, it allows to select an area to zoom in or you can also zoom (both in and out) directly with Ctrl + mouse wheel. To restore the original size of the graph, as mentioned above, click on the Autoscale button available at the top right of the box for each graph.
This perspective has no main menu.