Main perspective
The MAIN perspective displays process views and can host one or many in different tabs in the top part of the screen.
Information about the process view
When the mouse hovers over a node or transition, it displays detailed statistics about averages, median, aggregates, numbers, etc… of the occurrences (e.g., patients) traversing the node or transition, as shown in Figures 23.a and 23.b. In the case of nodes, it also displays the node name at the top.
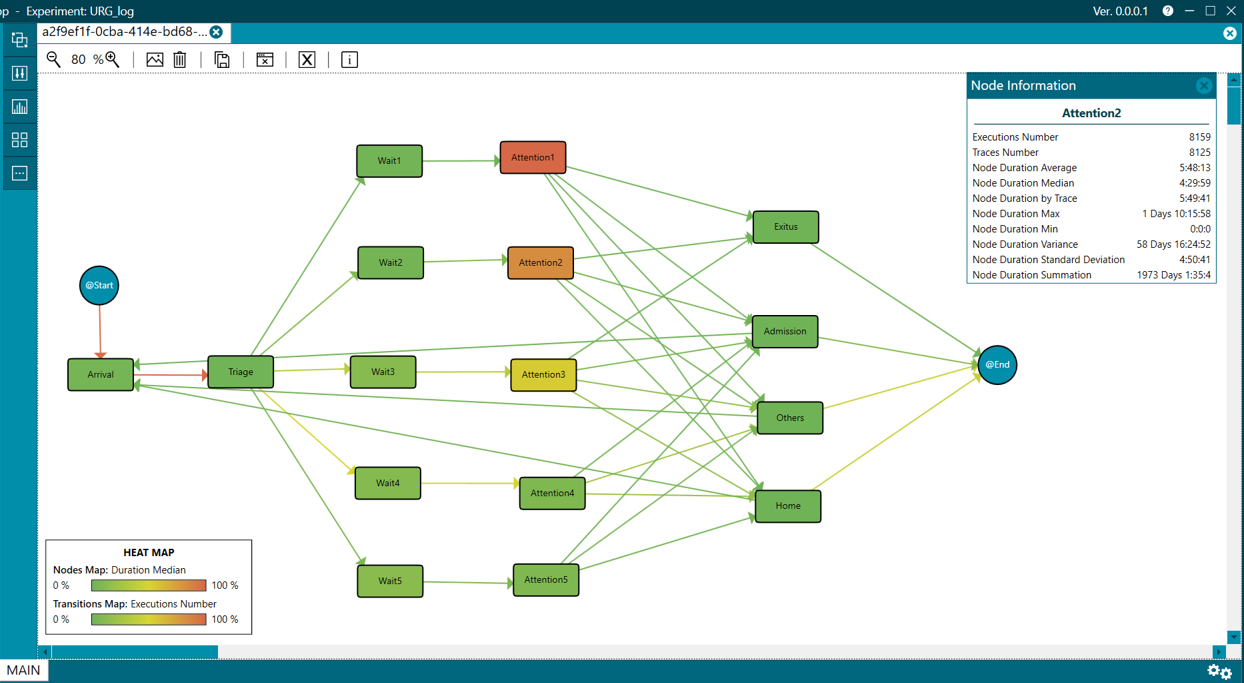
Figure 23.a. Node information tooltip
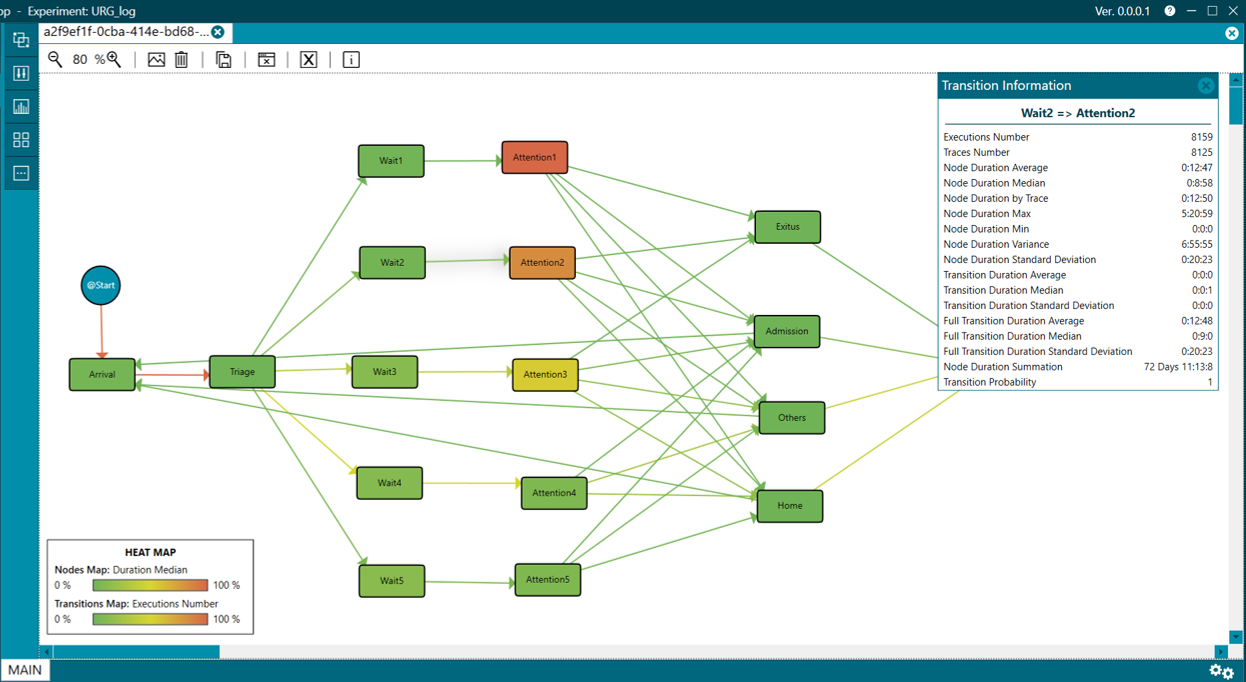
Figure 23.b Transition information tooltip
Right-clicking on a node or transition brings a contextual menu with two options (figure 24)
- Show Information. For more information about this check Node Information perspective or Transition Information perspective.
- Show Traces. Opens a new perspective with information on the traces that traverse that node or transition. For more information check Trace Information perspective.
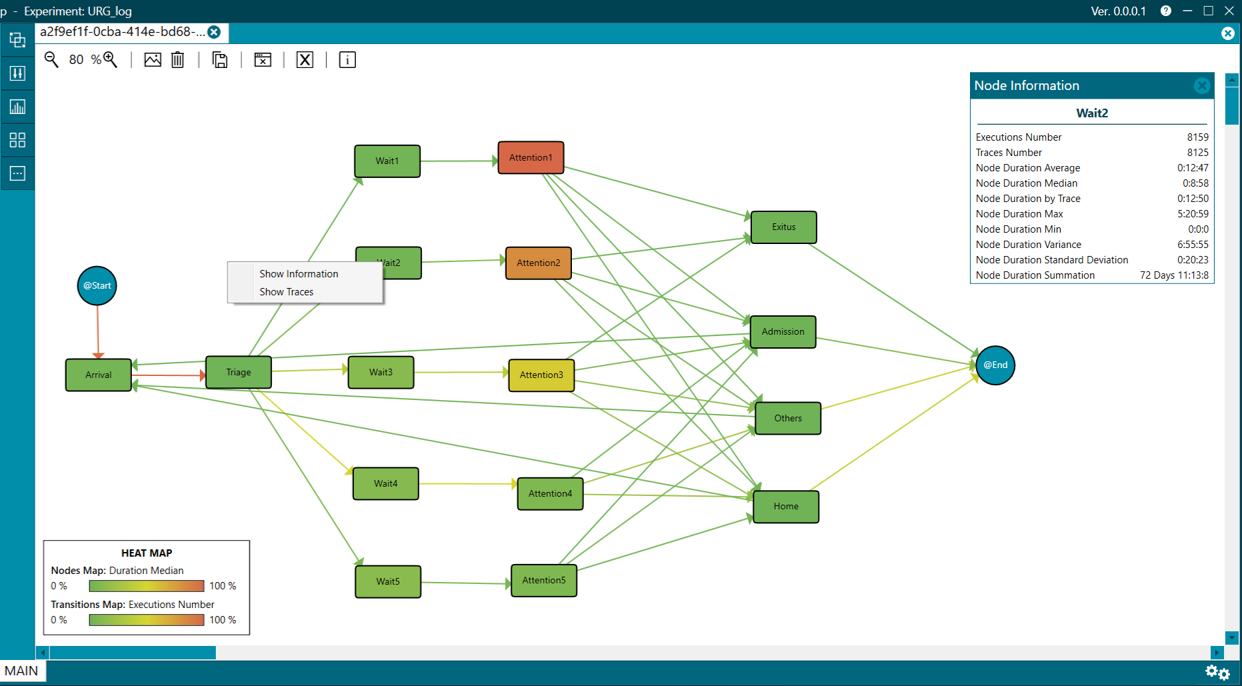
Figure 24. Contextual menu for accessing node or transition information
Menu of a process view
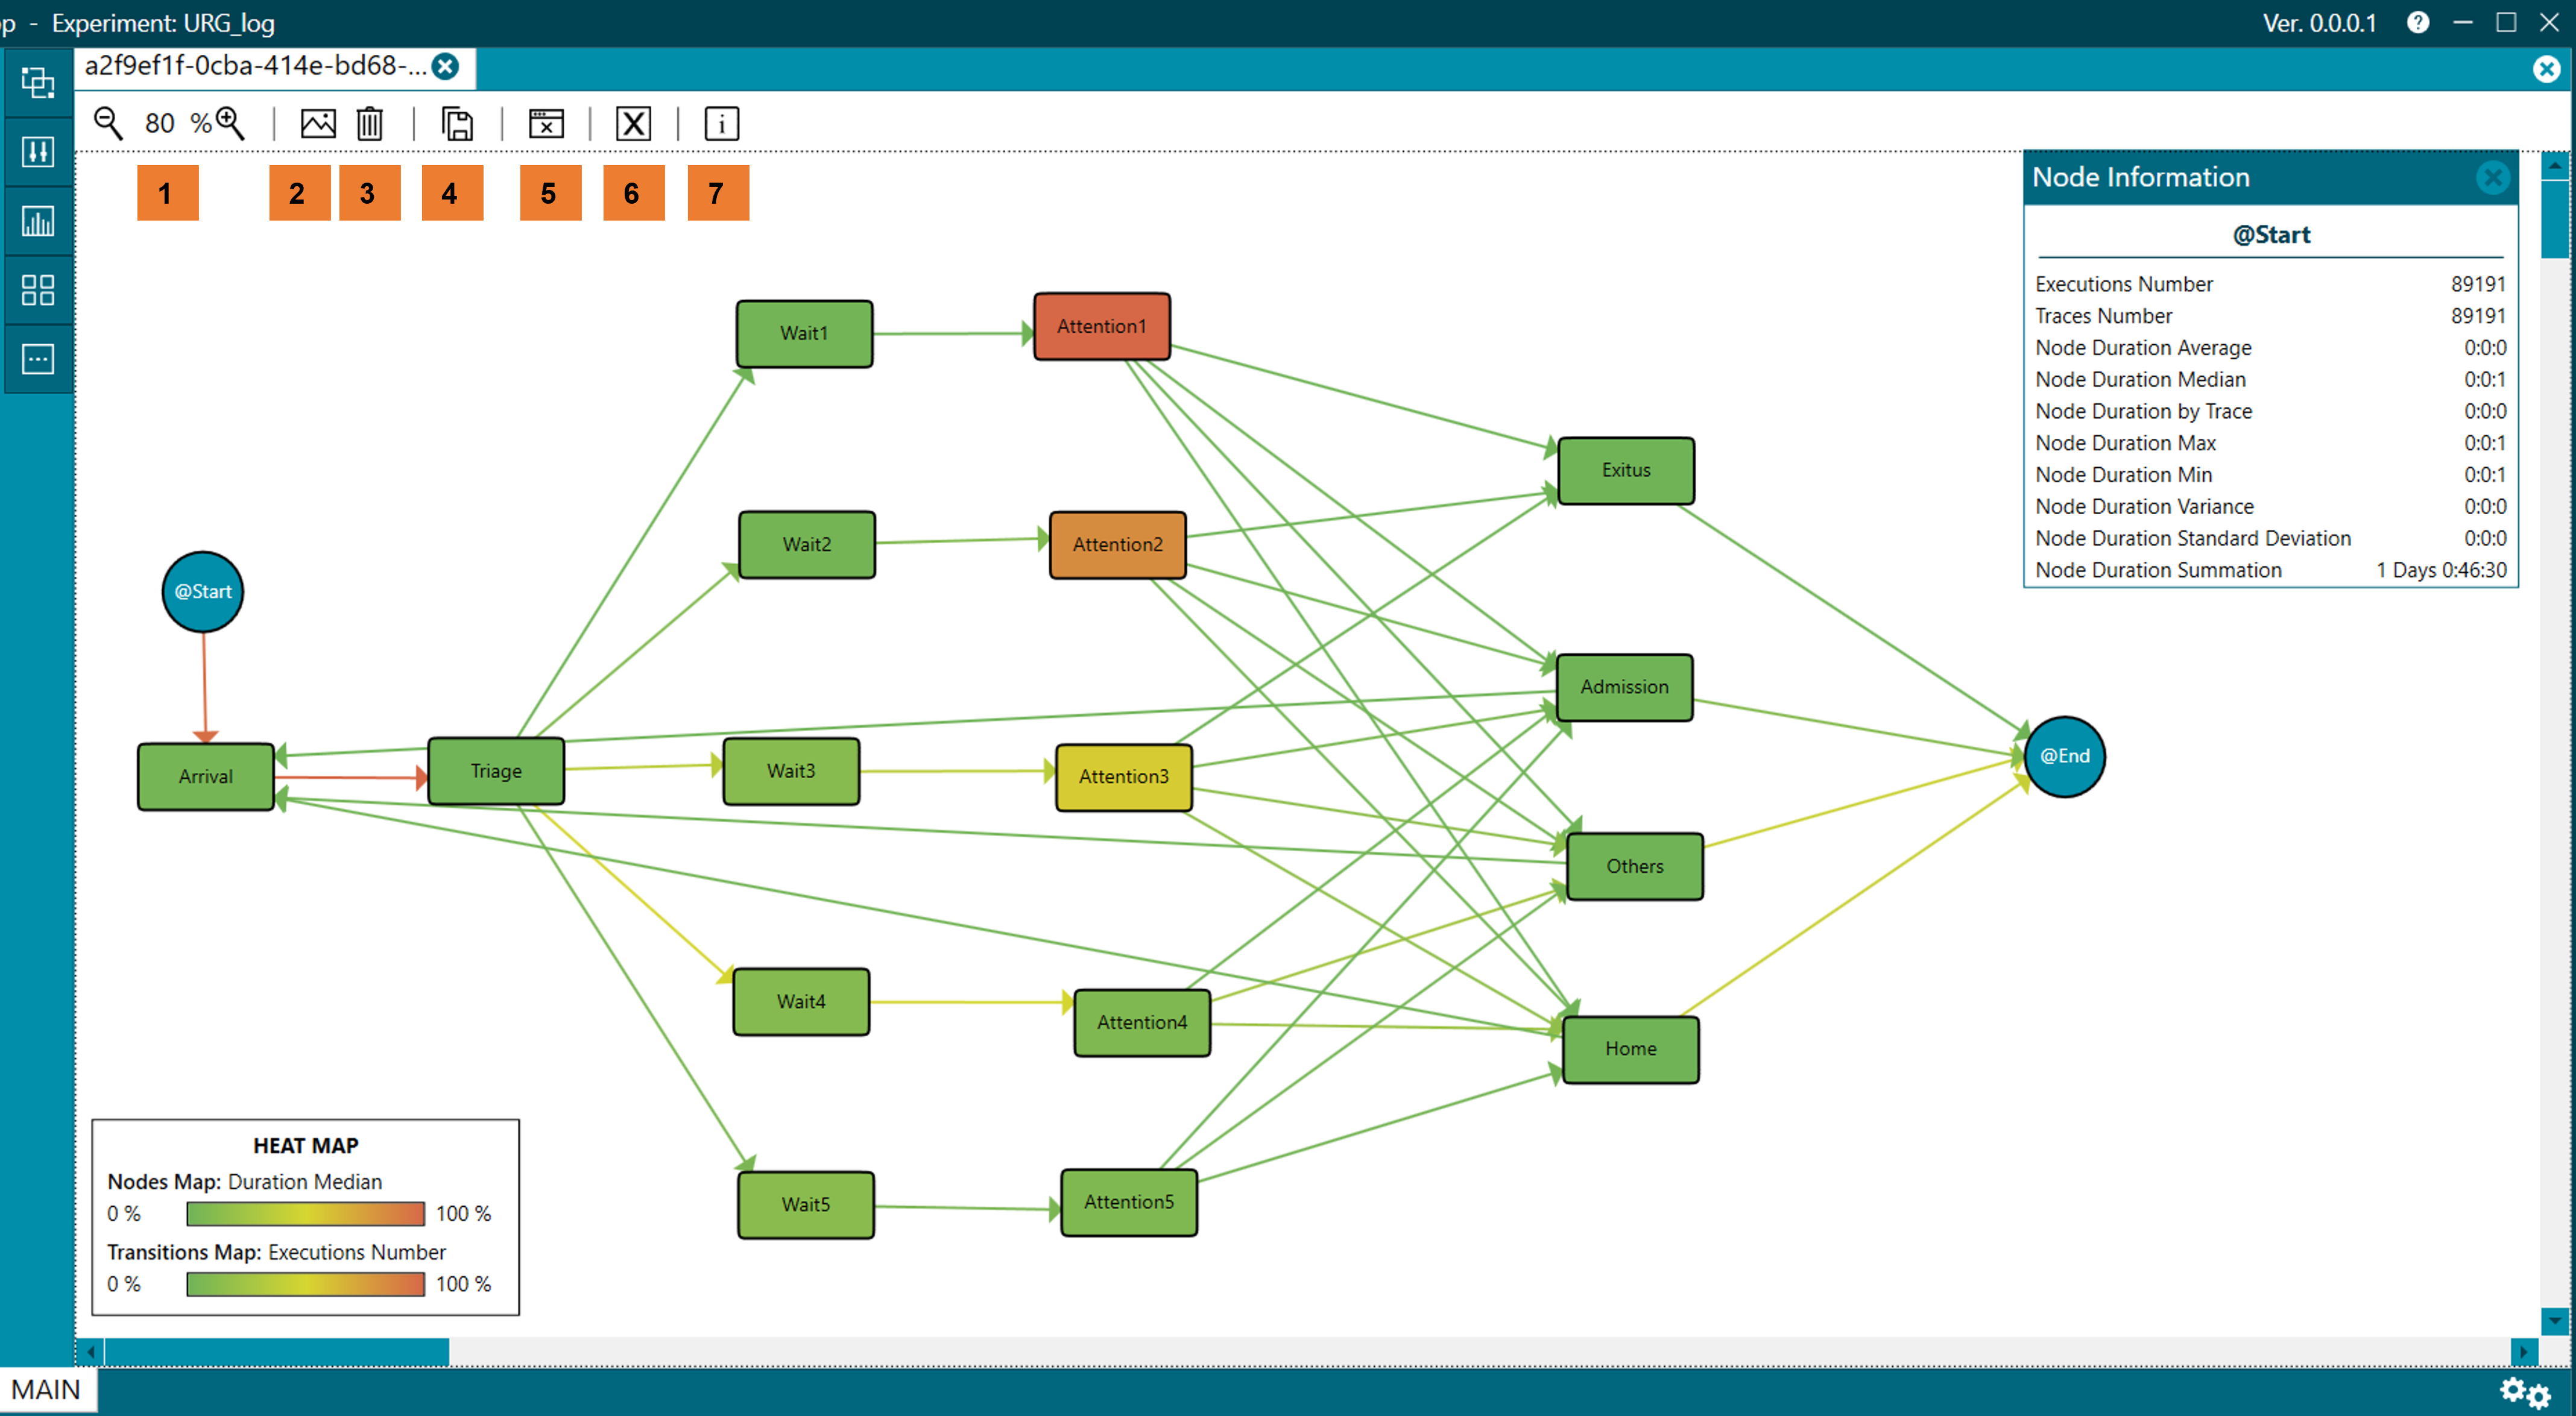
Figure 25. Menu for each process view
The actions that can be performed in each process view – that is, in each tab – (figure 25) are:
- Zoom out/Zoom in (1). Zoom in or out in the process view.
- Add background (2). Add an image to the background.
- Delete background (3). Remove the image that was added to the background.
- Save as (4). Save information from the process view. As shown in figure 26 there are different options, including:
- JPEG Image (*.JPG). Save the process view as an image.
- The other options save the process view as a CSV file, which allows opening it in Excel for further calculations:
- TPA Node Stats (*.csv). Stats associated to nodes in the process view.
- TPA Node Durations (*.csv). Duration of the nodes in the process view.
- TPA Trace Stats (*.csv). Stats associated to traces in the process view.
- It is also possible to save the process view as an ECSV file. For more information check: ECSV Format
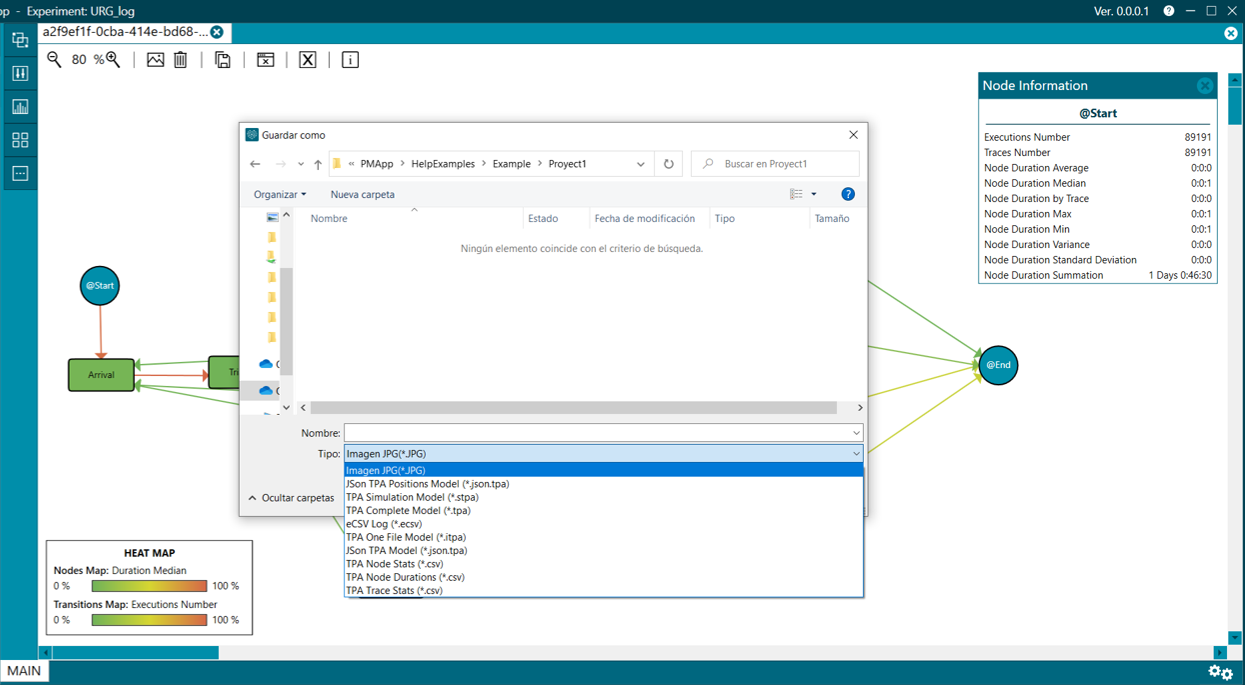
Figure 26. SAVE AS
Disable/Enable floating information window (5). If you click on a node or transition, a floating window will appear, with the same information that appears when hovering the mouse over the node or transition. The button in the menu is used to show or hide these floating windows once a node or transition has been selected. An example of a floating window is the following figure.
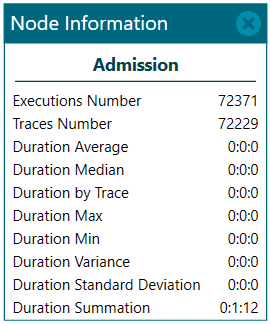
Figure 27. Floating screen with statistical information
Disable/Enable legend (6). Both nodes and transitions appear colored in process views. To know the meaning of these colors, a legend is shown that may be visible or hidden, depending on this option.
Process view information (7). This option displays a screen where you can make annotations associated with the process view. In the specific case of the MAIN perspective, name of the process view that is generated when opening PMApp and executing the experiment, it will be the same, as shown in figure 28, although in the case of having generated new groups, the options selected by category would be listed. In those categories in which all the options have been selected, it will be shown as PROCESS.
From this screen you can change the name that appears in the tab, modifying it in Name and then clicking on the SAVE button.
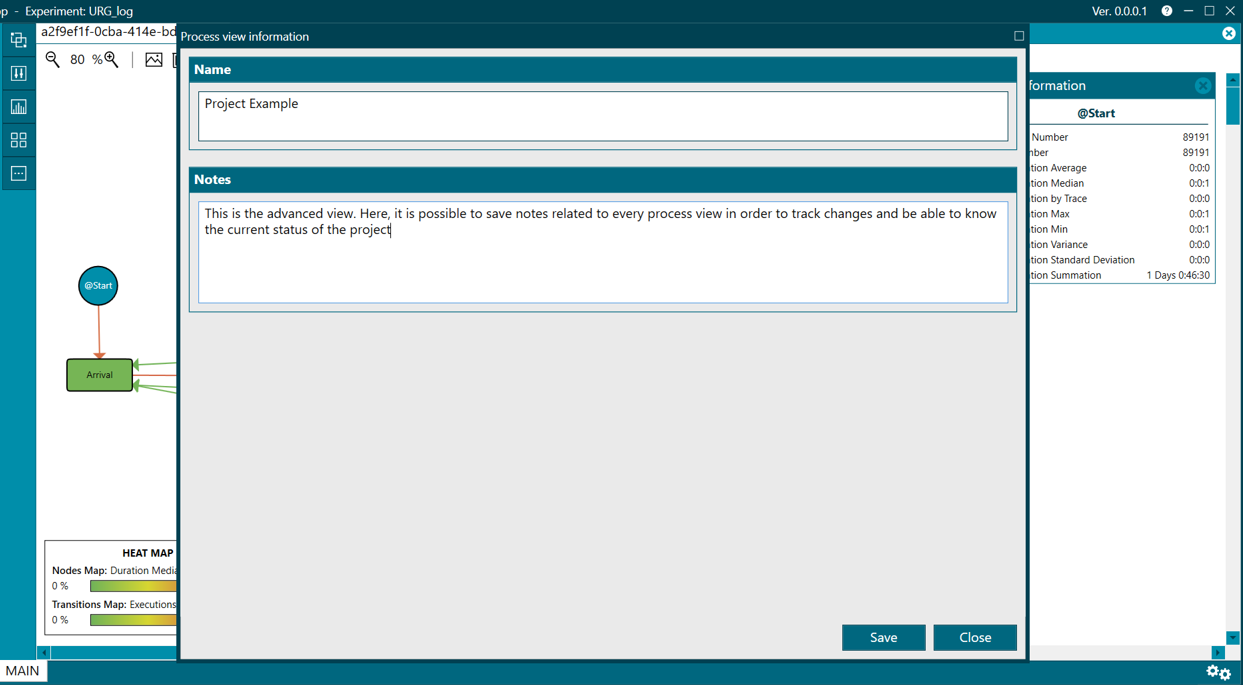
Figure 28. Screen with the information about the process view
Menu of the main perspective
On the other hand, this perspective allows taking certain actions about process views. These are found in the left menu:
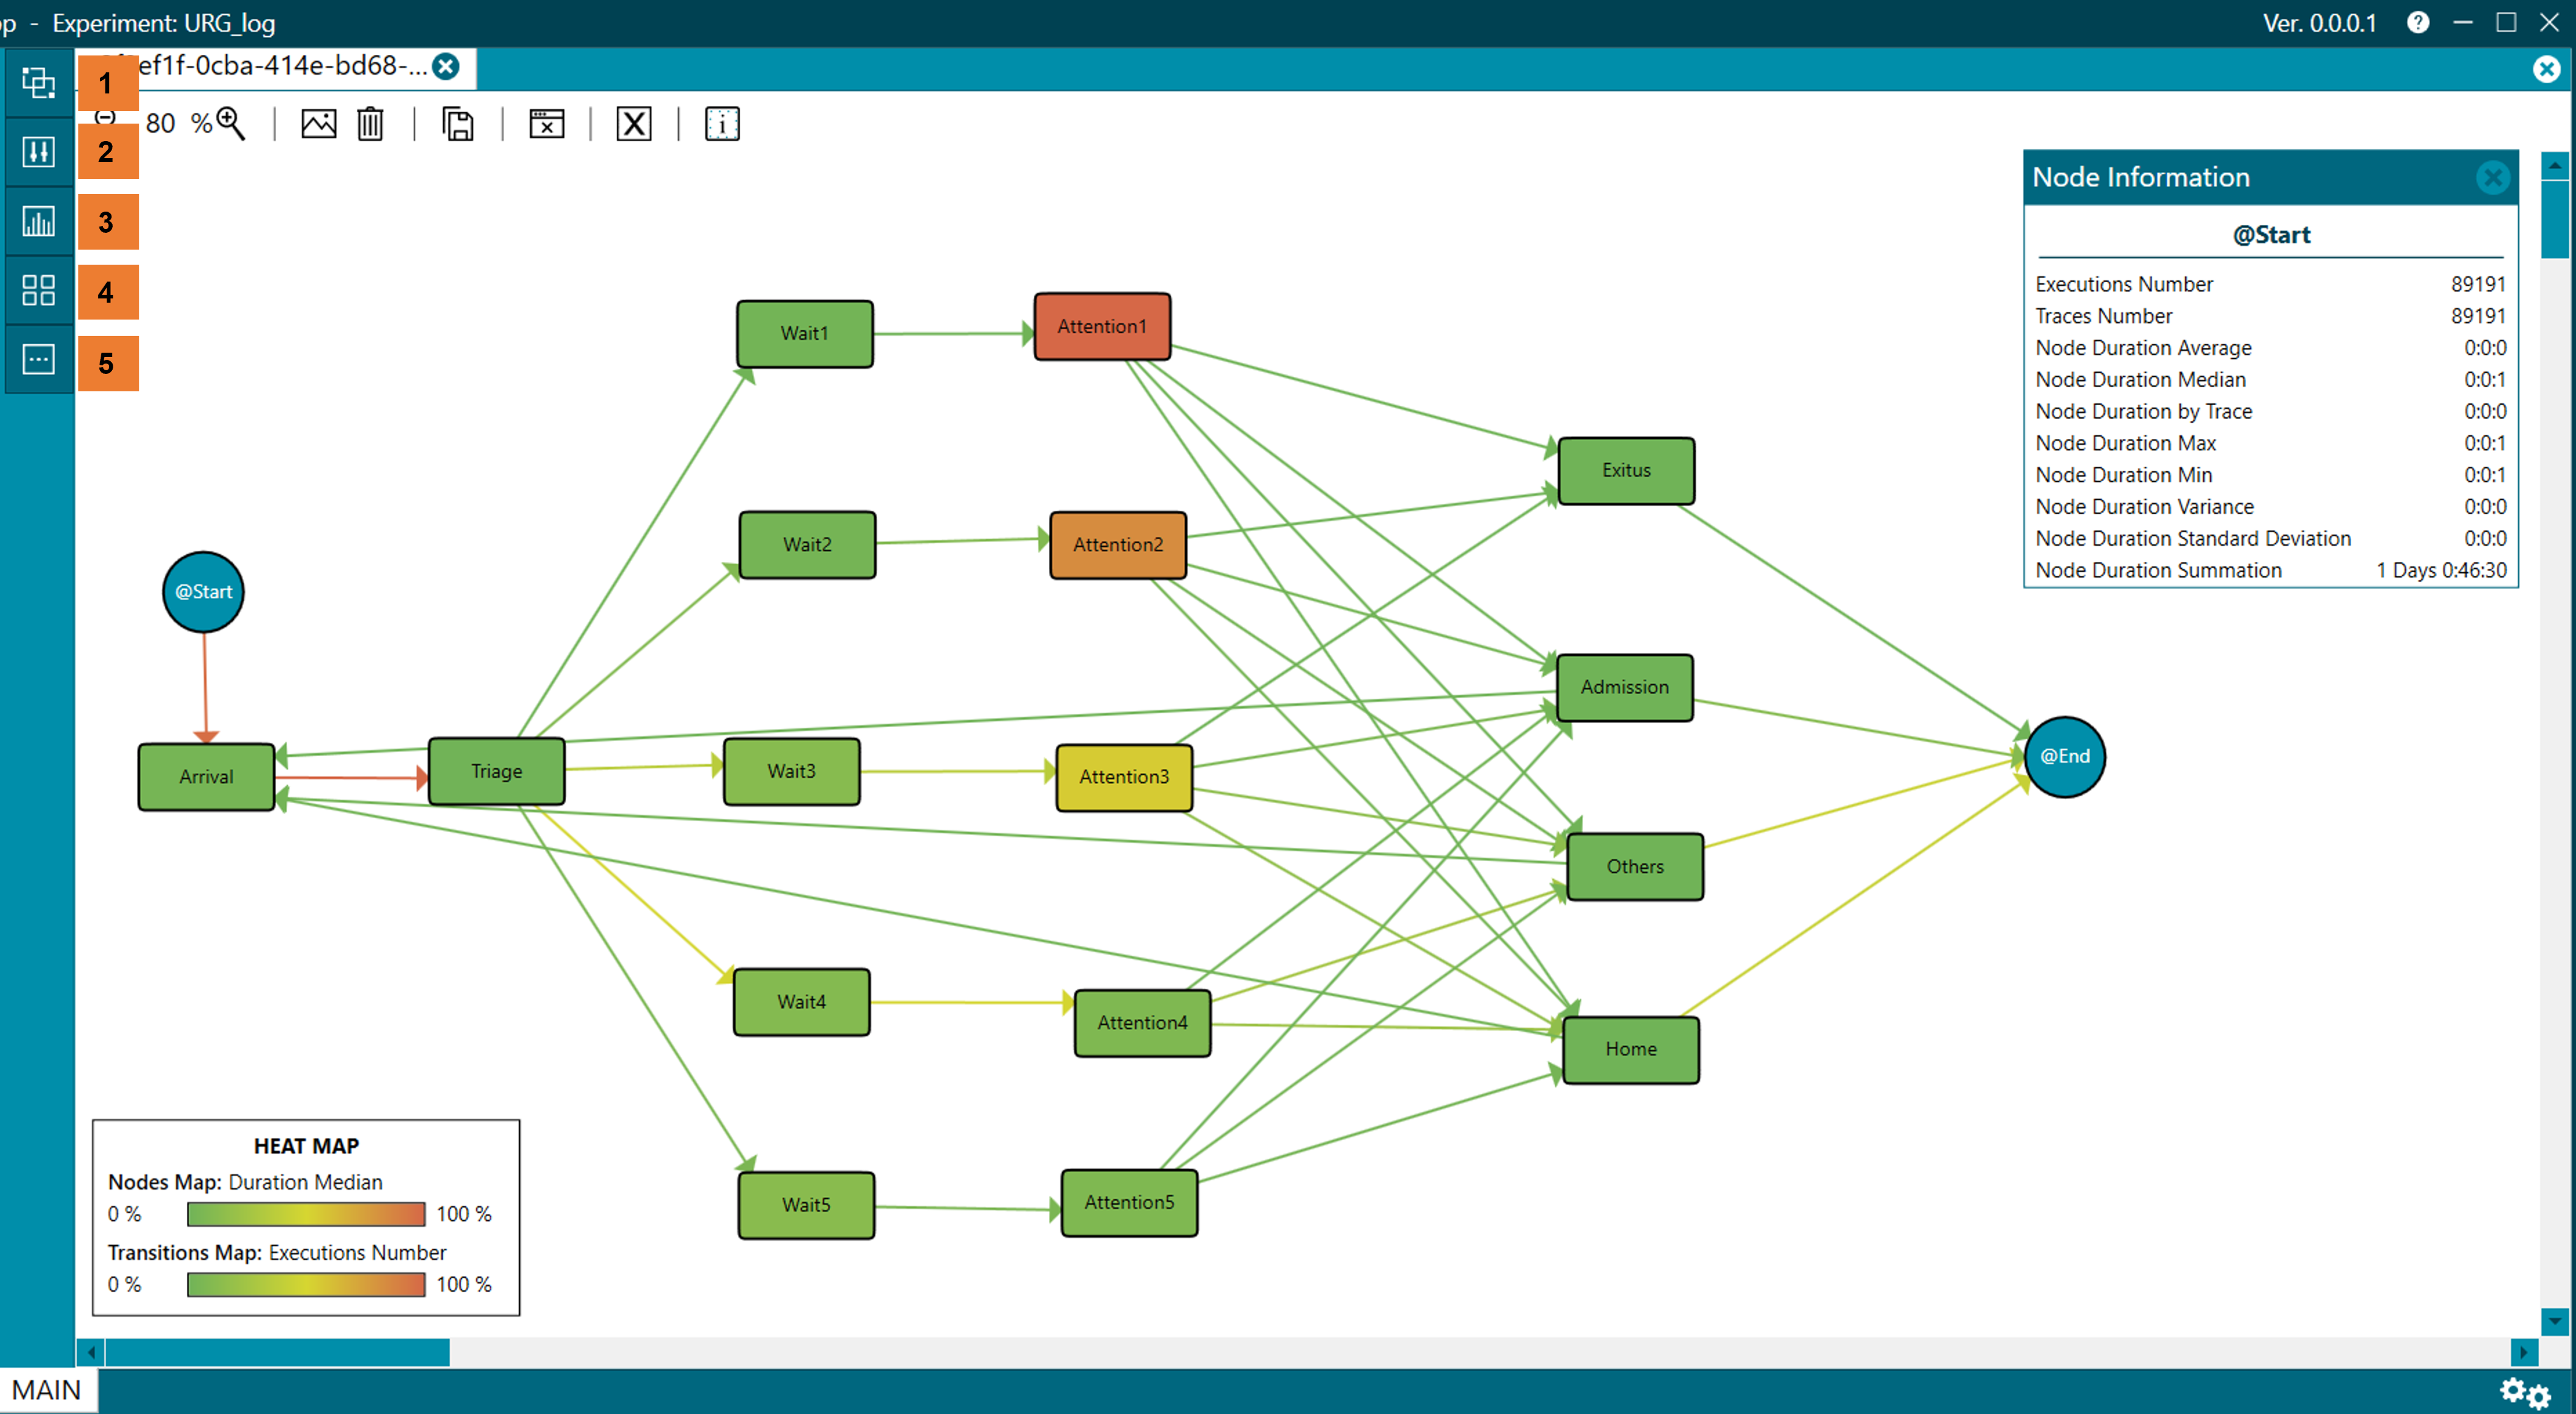
Figure 29. Left menu
- Groups (1). From the preloaded data, select a subset of that data to generate new process views for easier analysis. For more information check Groups menu
- Enhancements (2). Here you can add colour maps to the present process views. This helps to highlight different aspects. For more information check Enhancements menu
- Statistics & Charts (3). In this menu you can configure the stats to show, choosing the type of data to show and the right representation (graphics, tables…). For more information check Satistics and Charts menu
- Other views (4). In addition to the MAIN perspective, other perspectives are available from this menu. For more information, check Other views menu
- More options (5). This menu shows information regarding the experiment. For more information check More options menu