Data rodeos
Research phase looks for tailoring PMApp through the definition of an IPI during data rodeo sessions to support health professionals.
In this phase, the main aim is to use process mining tools available to create accurate process indicators that provide adequate ways to measure and understand the processes and their changes.
The objectives of this session are to define and analyze the process, validate the values obtained and its quality (applying corrections if necessary), and train health professionals in getting the understanding of using the application and analyze the data by themselves; preparing the logs; and applying process mining discovery, conformance and enhancement techniques to achieve the best process indicators for the problem at hand.
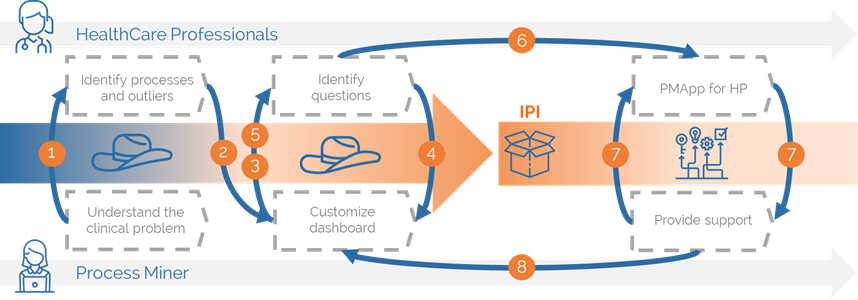
The definition of an IPI is done through data rodeos sessions that will take place between health professionals and process miners as follow:
(1) At least one process miner and one health professional carry out as many data rodeos as needed to build an IPI. (2) The process miner shows the first process views ...
(3) ... the health professionals identify processes and outliers that bring to questions and hypothesis ... (4) ...that the process miner translates into new process views ... (5) ... these new views are presented to the health professionals and may lead to new questions ...
(6) ... that are interpreted by the process miner as new views. (7) Once the IPI is defined, it is distributed between health professionals as the PMApp dashboard (PMApp plus a runner). (8) Then, the health professionals use the dashboard in their daily practice to empower their decisions with the support of the PM expert if needed until new questions need to be answered, where they will be back to the data rodeo phase (3) until the IPI is ready again.

Figure 5. IPI definition process
Data rodeo process
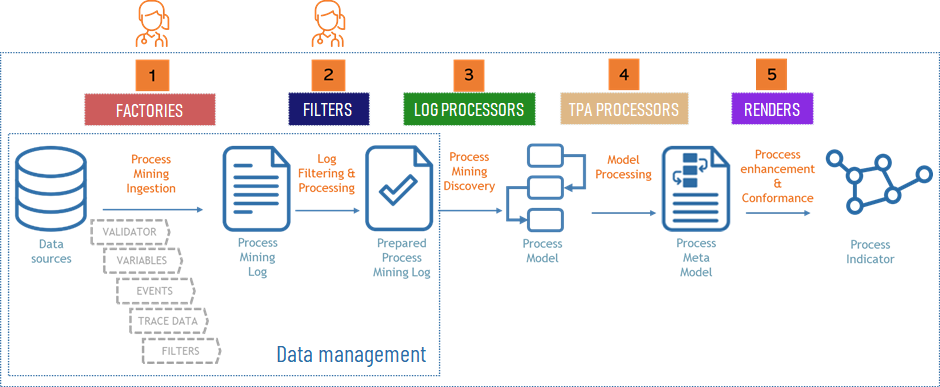
During a data rodeo the process miner translates the requirements from the health professionals into a runner. These indications influence especially in the first phases of the execution of a data rodeo, which are related to the data management. The whole data rodeo process is as follow:
(1) Factories. The process miner selects the data sources using factories to extract the data and to create the process mining log by collecting the available events. Some of these factories require the creation of an ingestor, which is implemented in the Ingestor Editor.
(2) Filters. Filters the raw data to select the specific data to be mined. Filters are used to correct, filter and group data to show more adequately the process, according to the health professionals' requirements.
During the data management stages, the health professionals identify the events of the process and, if needed, additional metadata. The process miner defines rules to assess the processed data quality by defining validators. These validators deal with invalid values such as empty or NULL values. The process miner implements filters according to the criteria provided by the health professionals. Any of these criteria are determinants for the result.

Figure 6. Data rodeo process
(3) Log processors. Once the log is prepared, it is run a process discovery algorithm to create the graphical model from the log.
(4) TPA processors. The model is processed for creating and computing specific maps and stats or other post-discovery modifications in the models.
(5) Renders. Finally, it applies different renders to show specific insights in the graphical solution and highlight the specificities that health professionals need to understand, measure and compare of their clinical process.
The data rodeo process is implemented in the Experiment Designer.
Ingestion process
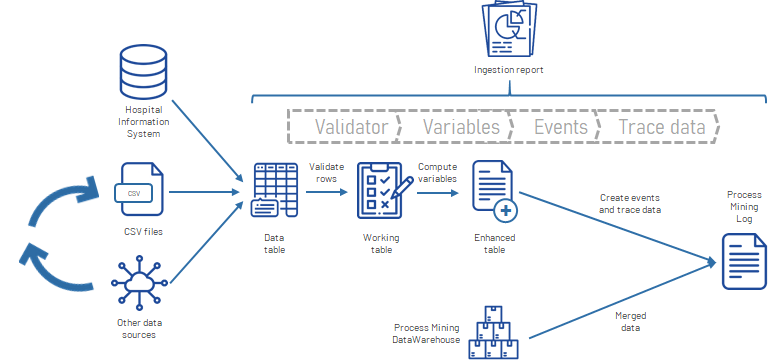
The ingestion process receives the data from table based data sources and executes a flow for creating logs. This flow is as follow:
-
Validator. The process starts with a validation of the rows to select the adequate ones.
-
Variables. After that, the following step creates variables that are a combination of the variables retrieved in the previous phase.
-
Events and trace data. The next phase is the creation of events that defines the process, and trace data associated to it.

Figure 7. Ingestion process
It is desirable to access the raw database directly by building query languages, although Comma-Separated Values (CSV) is one of the most common format used. It there is no possibility to access directly to the data, it is recommended to transform the raw database into CSV to facilitate its processing. In both cases, the data should be represented in a set of rows and columns.
The ingestion process is implemented in the Ingestion Editor accessible from the Experiment Designer.