Transition Information perspective
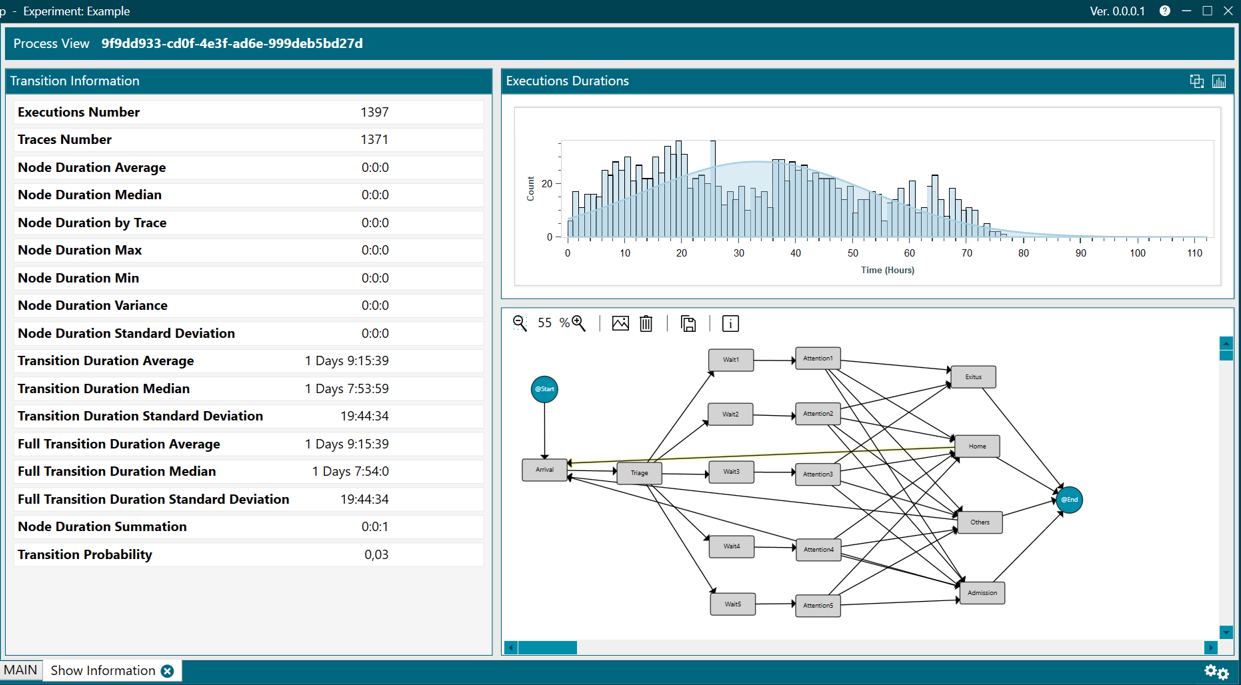
The TRANSITION INFORMATION perspective displays patient statistics (same as those taught in the tooltips), a histogram showing the number of run traces and the time taken for each one and the flow where the transition selection was made, which as shown in figure 1, is dimly highlighted in yellow.

Figure 1. Transition information
The meaning of each of these statistics is the following:
- Executions Number. Number of executions that traverse that transition.
- Traces Number. Number of traces that traverse that transition.
- Duration Average. Average duration of the time in the node of all executions associated to that transition.
- Duration Median. Median of the duration of time in the node of all executions associated to that transition.
- Duration by Trace. Time in the node of all executions associated to that transition divided by the number of traces that traverse the transition.
- Duration Max. Maximum duration among all time in the node of all executions associated to that transition.
- Duration Min. Minimum duration among all time in the node of all executions associated to that transition.
- Duration Variance. Variance of duration of time in the node of all executions associated to that transition.
- Duration Standard Deviation. Standard deviation of the duration of time in the node of all executions associated to that transition.
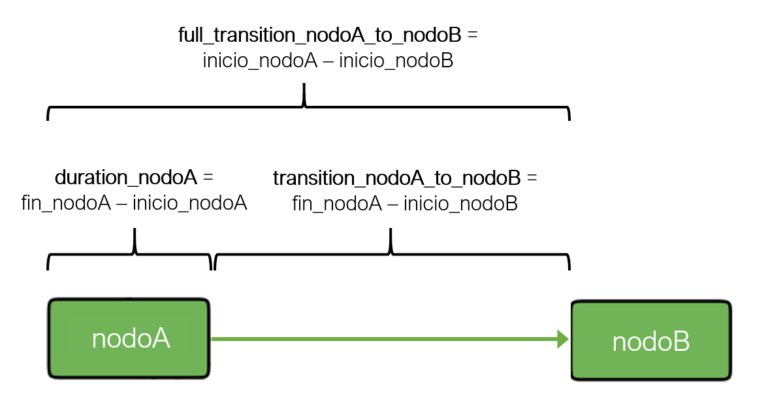
- Transition Duration Average. Average of duration of time in the node of all executions associated to that transition, understanding transition as the time between end of node A and start of node B (figure 2).
- Transition Duration Median. Median of duration of time in the node of all executions associated to that transition, understanding transition as the time between end of node A and start of node B (figure 2).
- Transition Duration Standard Deviation. Standard deviation of the duration of time in the node of all executions associated to that transition. That is, the closer the deviation is to zero, the less disperse the durations will be (with respect to the average). Conversely, the greater the deviation, the more disperse they will be, understanding transition as the time between end of node A and start of node B (figure 2).
- Full Transition Duration Average. Same as Transition Duration Average, but understanding full transition as the time between start of node A and start of node B (figure 2).
- Full Transition Duration Median. Same as Transition Duration Median, but understanding full transition as the time between start of node A and start of node B (figure 2).
- Full transition Duration Standard Deviation. Same as Transition Duration Standard Deviation, but understanding full transition as the time between start of node A and start of node B (figure 2).
- Duration Summation. Summation of all times in the node of all executions associated to that transition.
- Transition Probability. The probability that an execution traverses that transition.

Figure 2. Duration, transition y full transition
As in the NODE INFORMATION, in this perspective, both the options in the main header of the histogram and those that appear when hovering over it will be available.
Finally, the represented histogram allows:
- Consulting a specific value represented by the chart, by clicking with the left mouse button on the corresponding area,
- Scrolling the graph to the left or right by holding right click,
- With Ctrl + right click, it allows to select an area to zoom in, or you can also zoom in and out directly with Ctrl + mouse wheel. To restore the original size of the graph, as mentioned above, click on the Autoscale button available at the top right of the box for each graph.
This perspective has no main menu.