Main window
The first PMApp screen is shown after running an experiment. This screen is divided into three main areas:
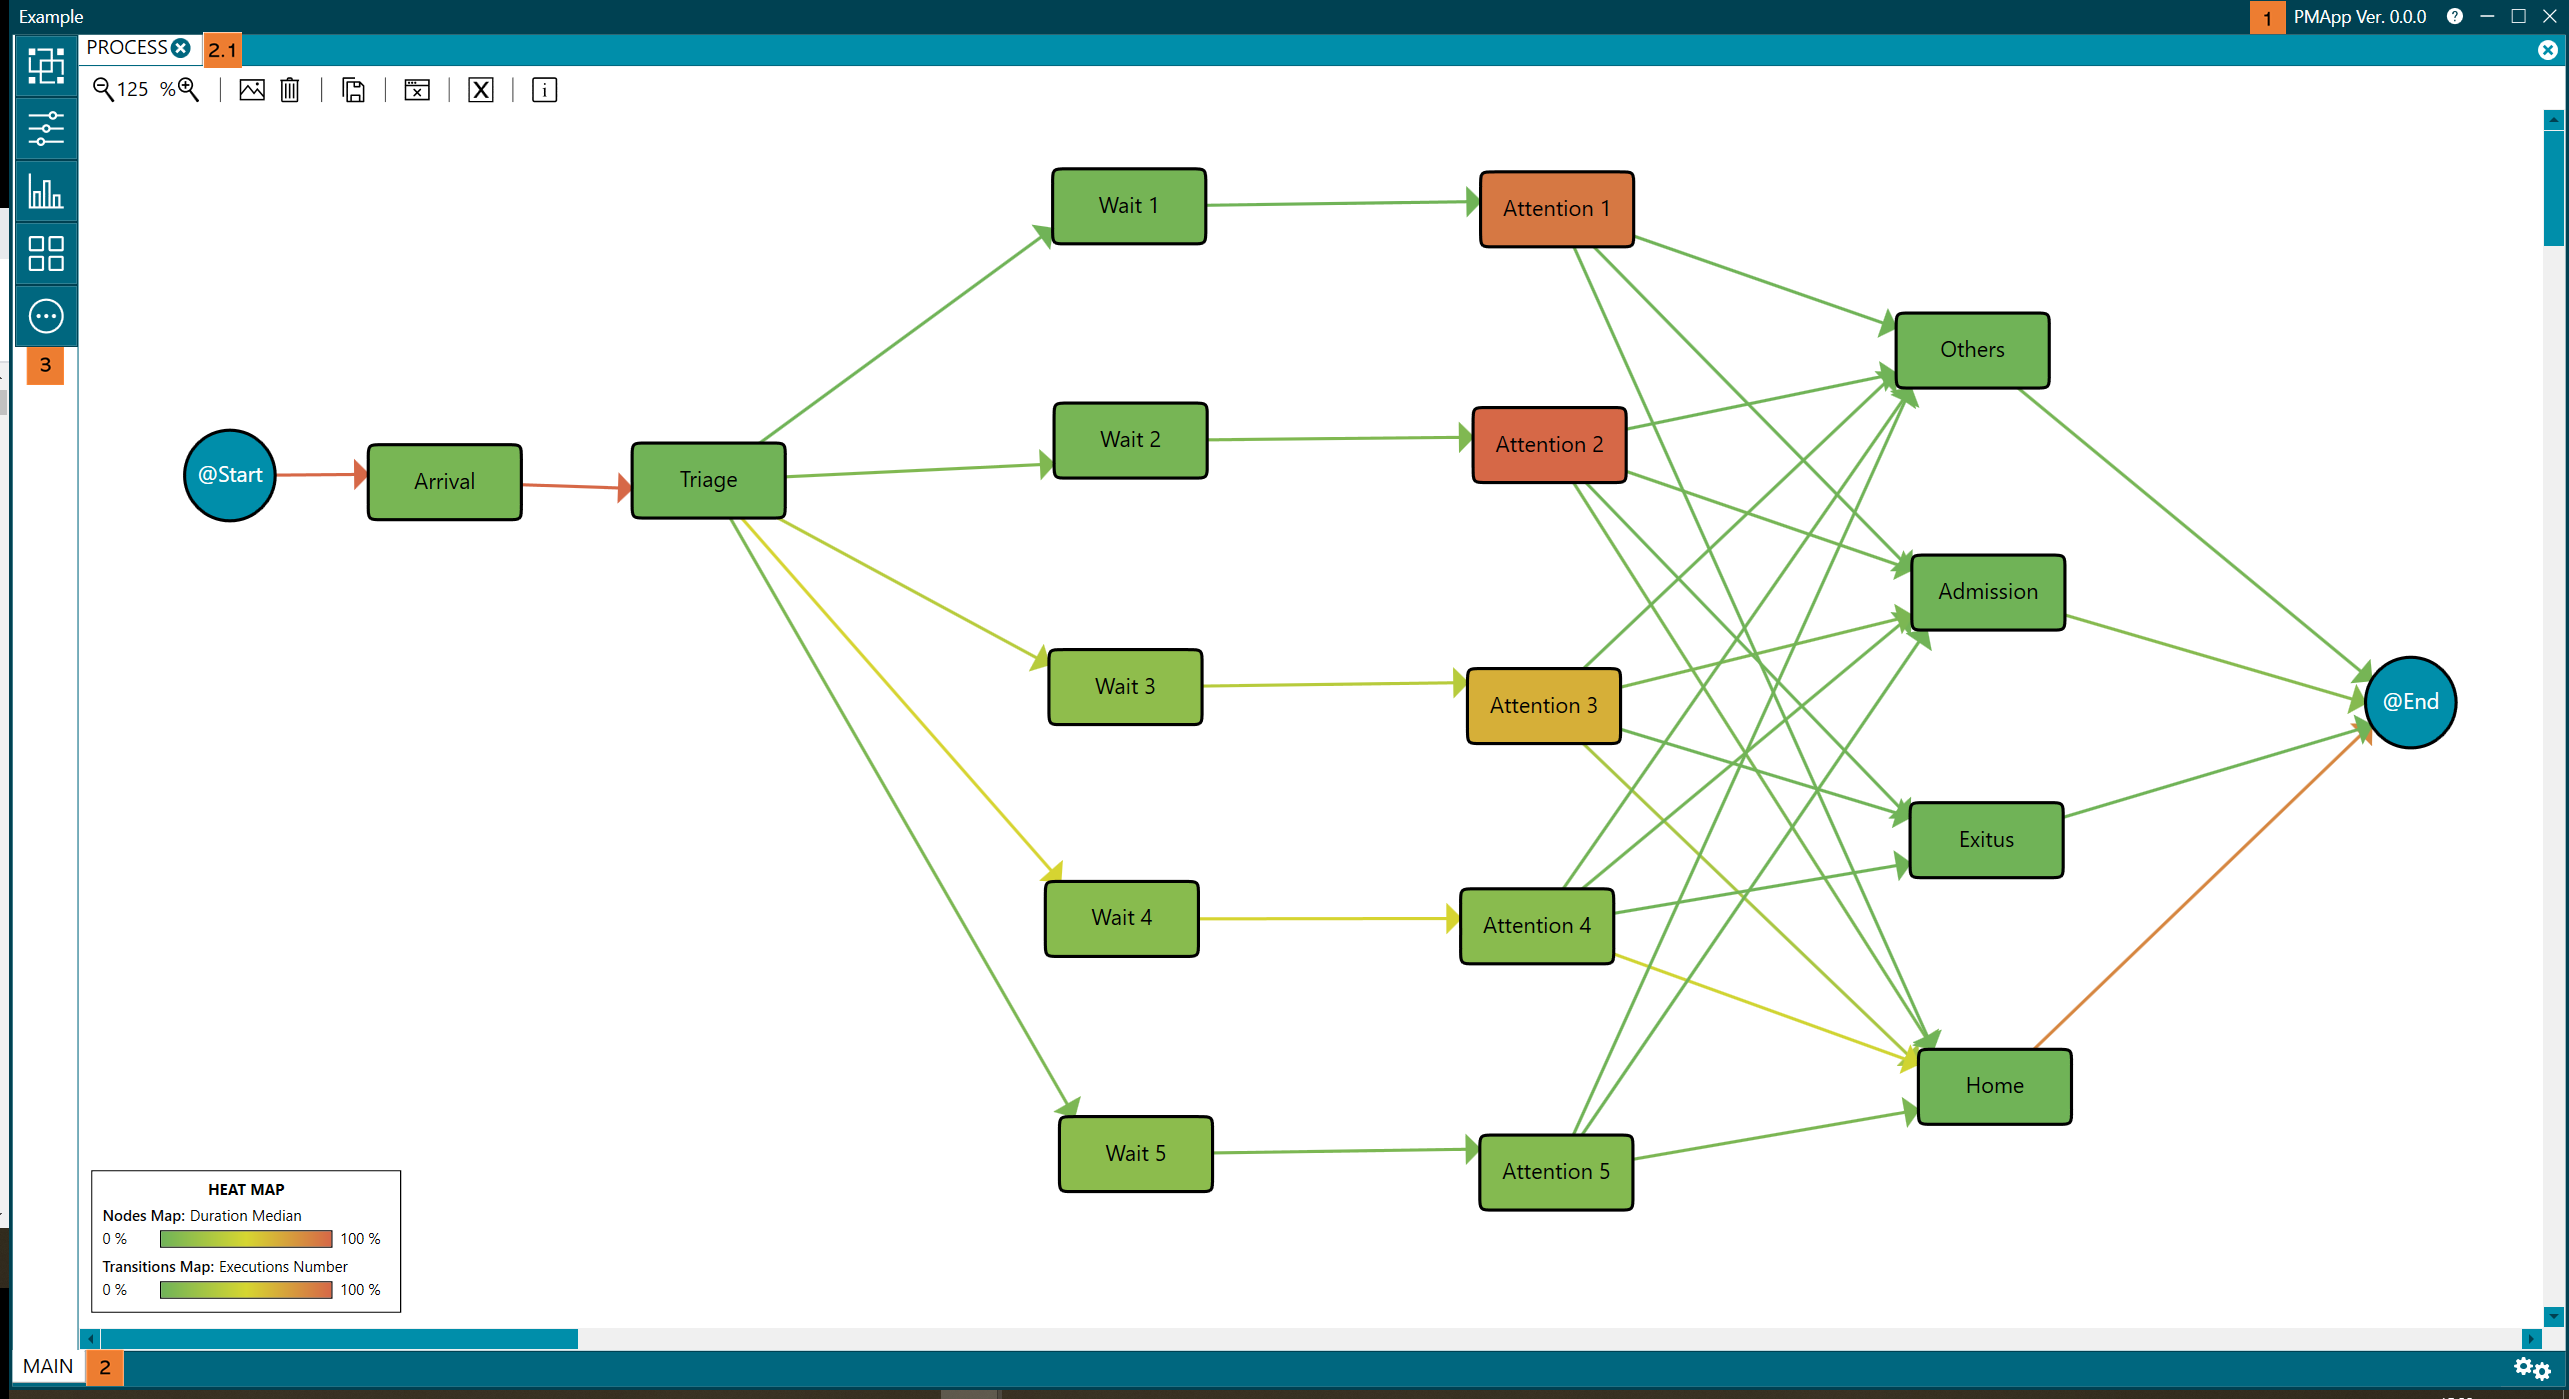
Figure 1. First PMApp screen after running an experiment
-
(1) Top toolbar. The name of the experiment appears to the left of this toolbar, and the application version and Help are placed to the right. Clicking on the Help icon opens an Internet browser. The toolbar also includes the typical minimize, maximize, and close buttons. Closing the experiment will lose any changes made until that moment. To avoid this, read More Options menu.
-
(2) Perspectives. The result of the run experiment appears in the MAIN perspective of the lower toolbar.
- (2.1) Process Views. This subarea is exclusive to the MAIN perspective, which contains as many tabs (top of the screen) as process views of the same type.
- These process views can be closed with the button (x) located on the right.
- (2.1) Process Views. This subarea is exclusive to the MAIN perspective, which contains as many tabs (top of the screen) as process views of the same type.
-
(3) Left menu. The menu shown in figure 1 is exclusive to the MAIN perspective, where the PROCESS view is shown by default. Each perspective has its own different menu.
Different perspectives
The following are the different perspectives in the current version of PMApp. They appear in the bottom-left part of the screen (2) as shown in figure 1:
Main
It represents process views and contains as many tabs as existing process views. Once an experiment is executed, the PROCESS tab shows the process view generated from the data in a runner. For more details, check Main perspective.
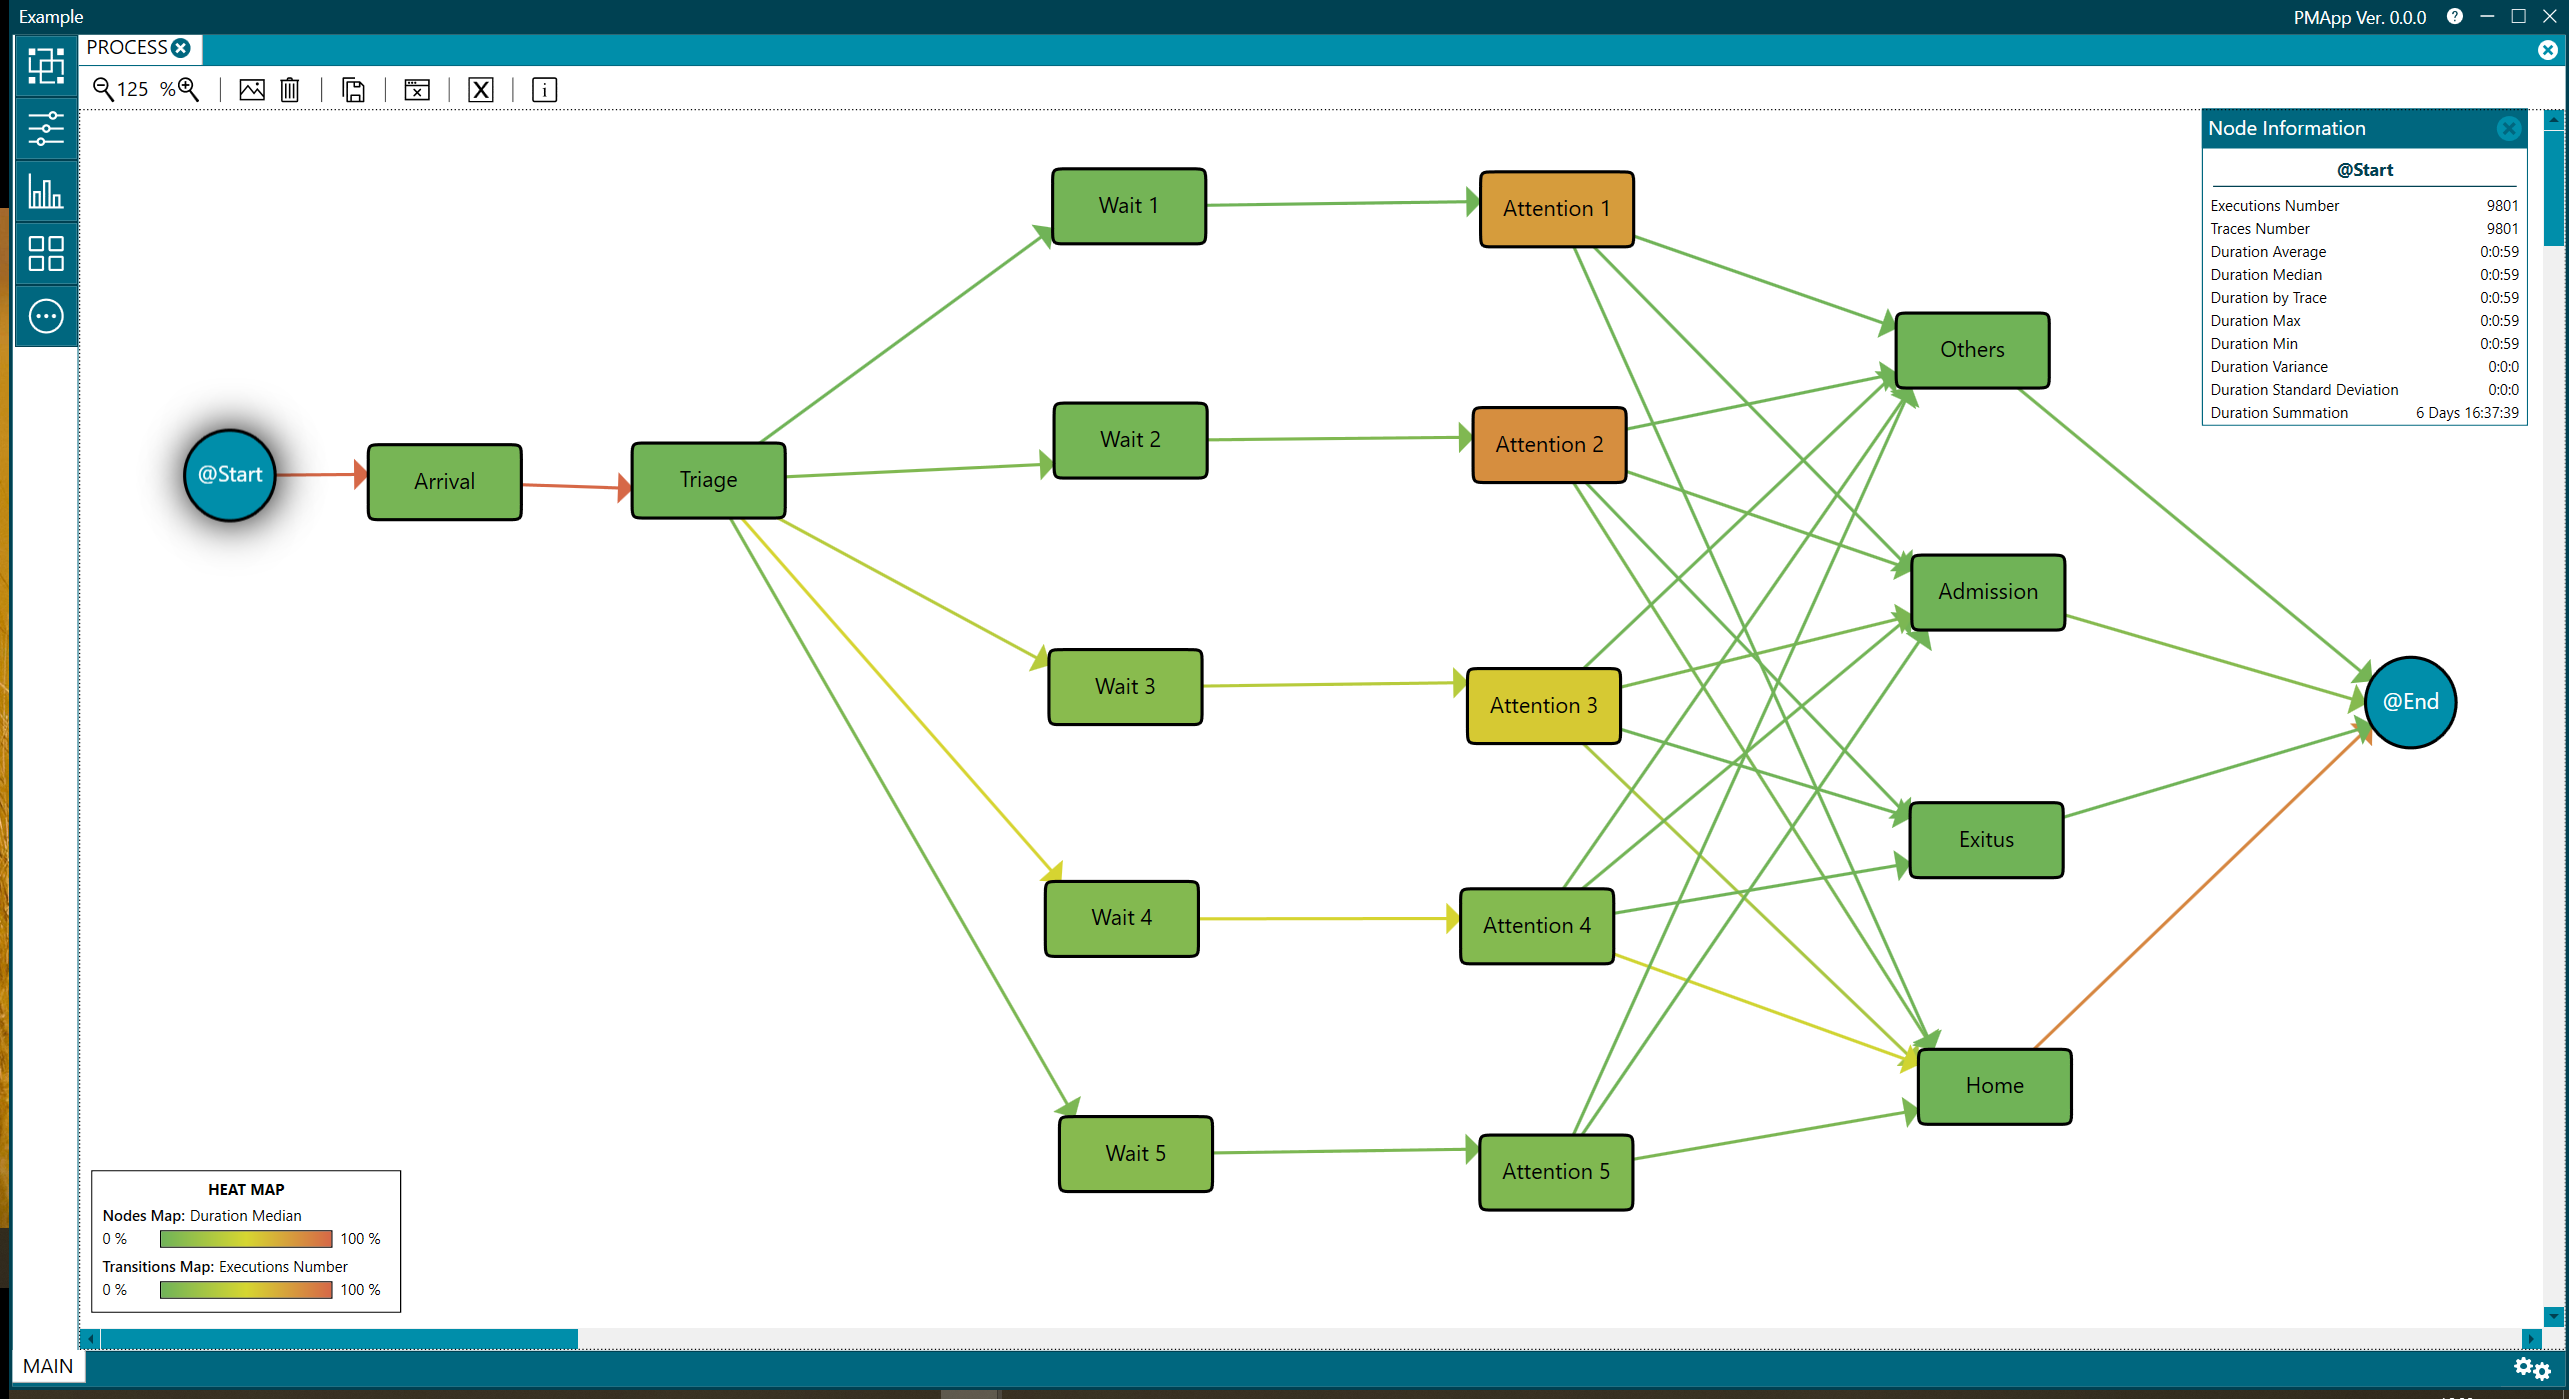
Figure 2. Main screen
Progress
This perspective shows the internal actions performed by PMApp. It can be opened by clicking on the gear button on the bottom-right corner.
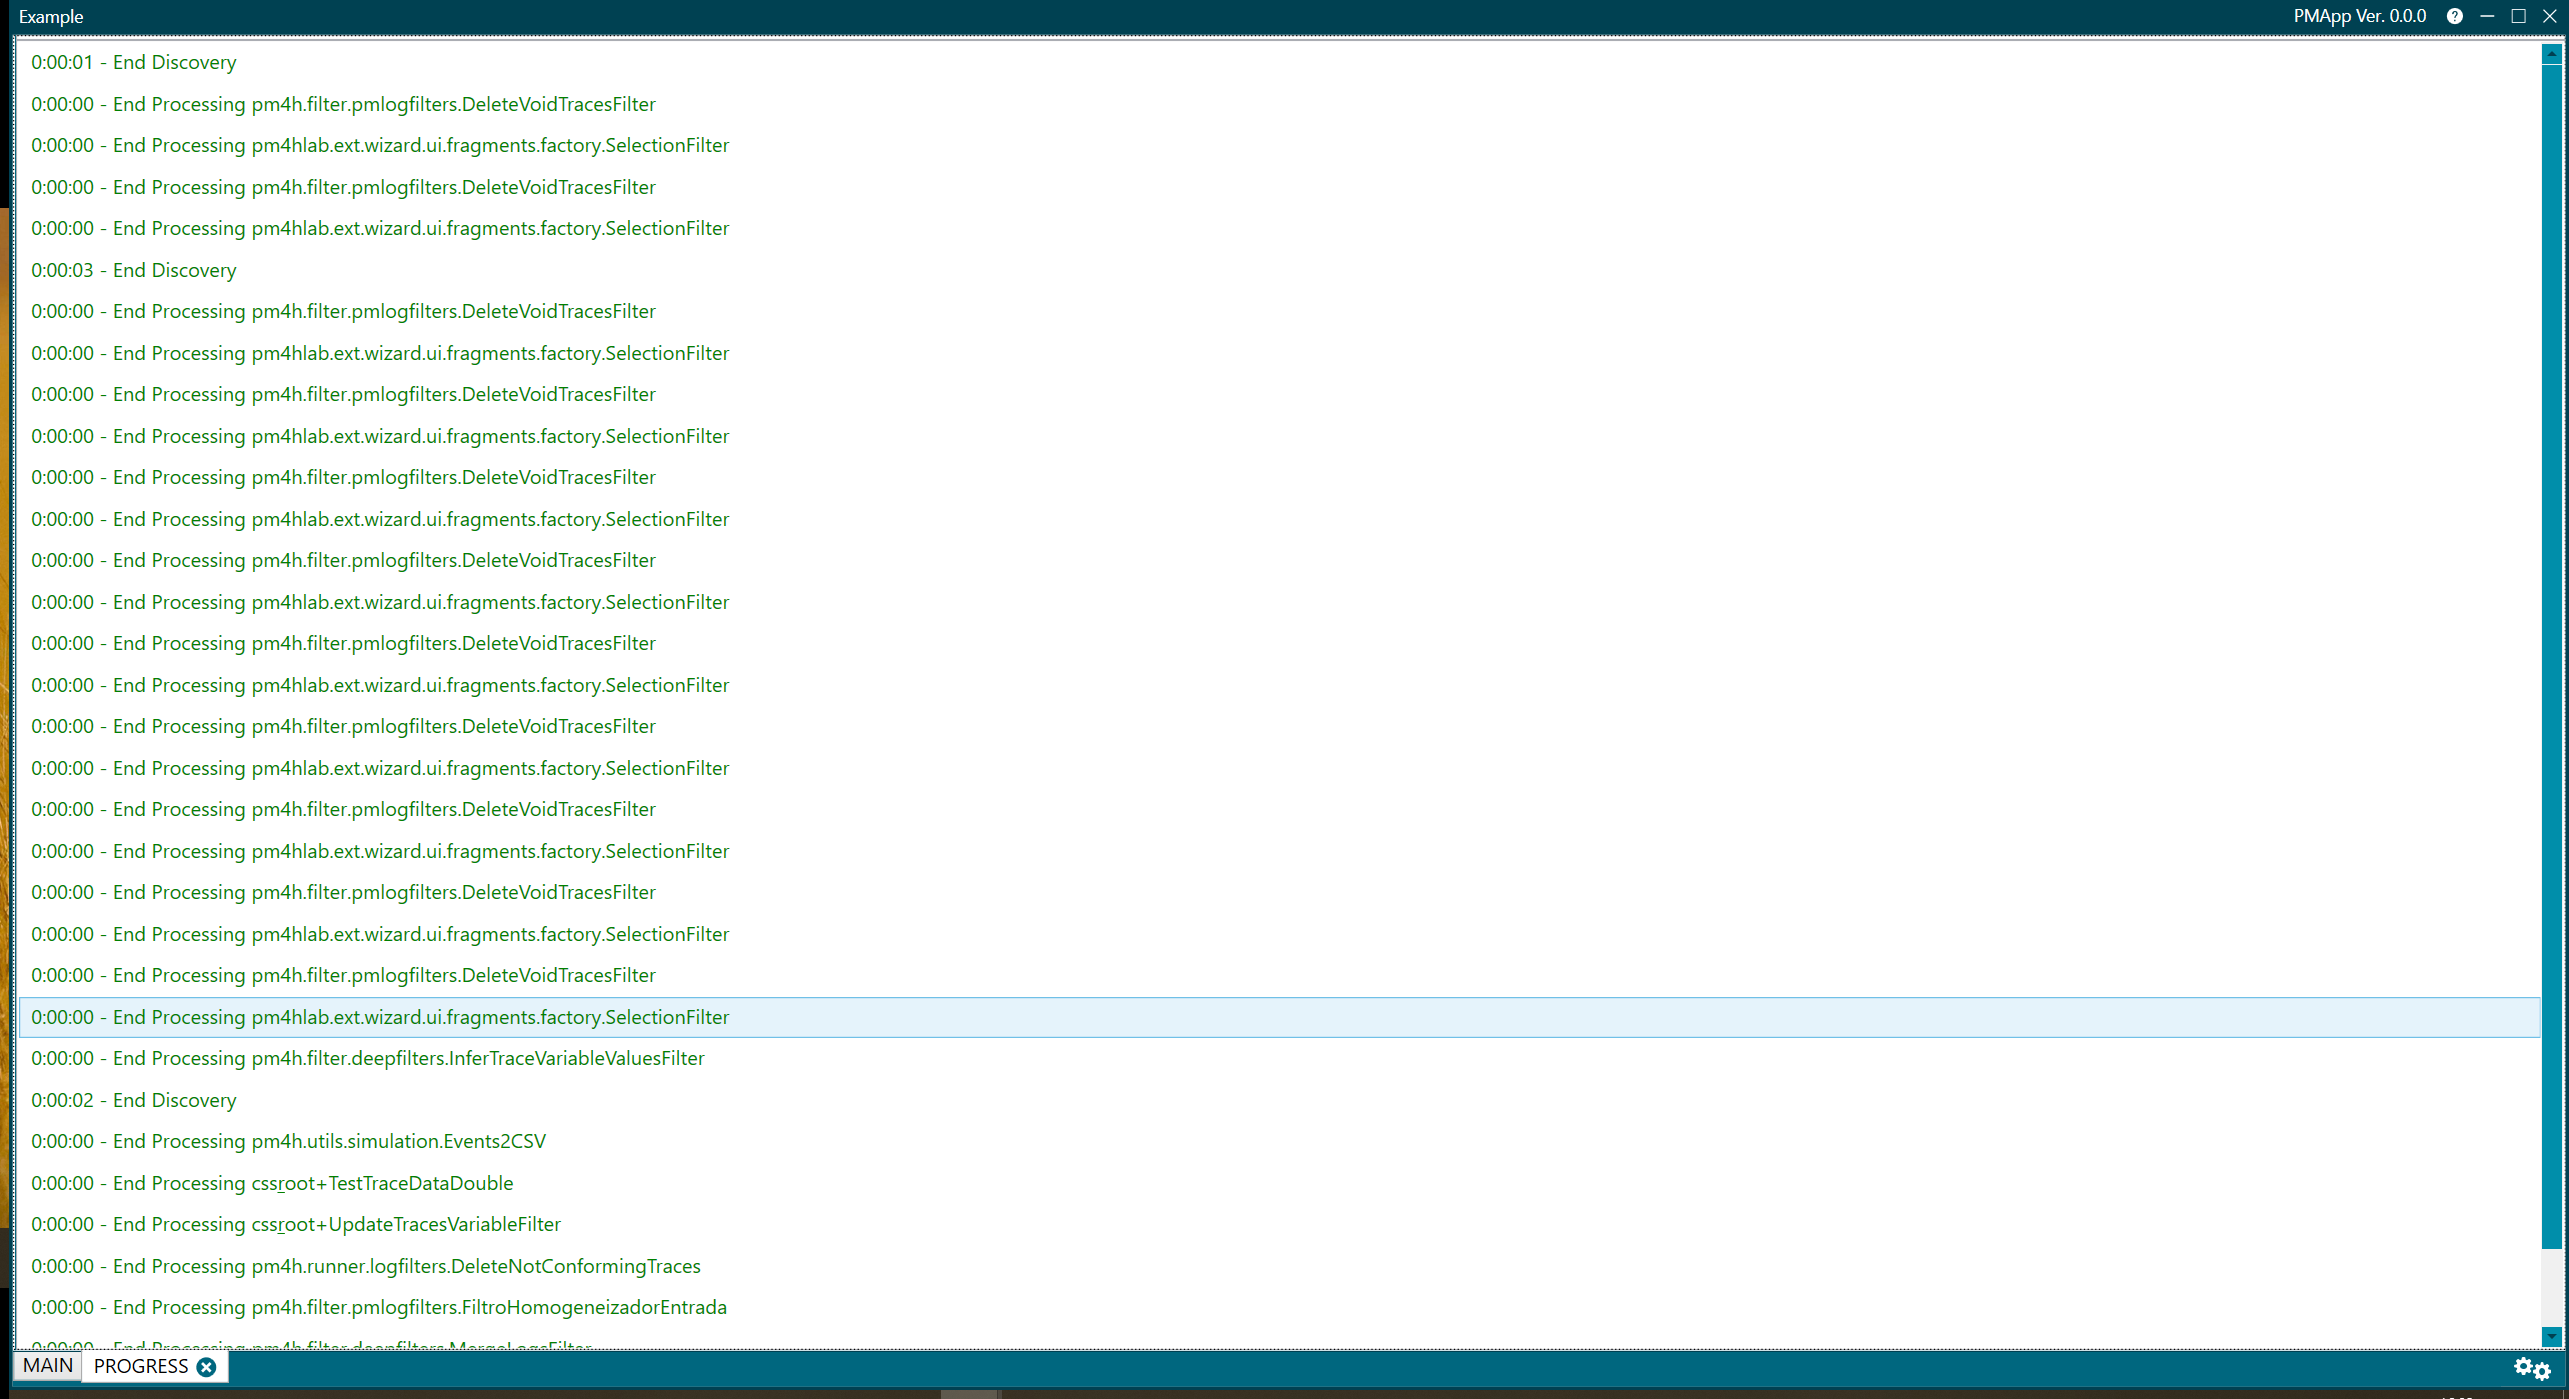
Figure 3. Progress
Experiment configuration
This perspective displays information about the experiment. It can be opened from the More Options menu. For more information check More options menu.
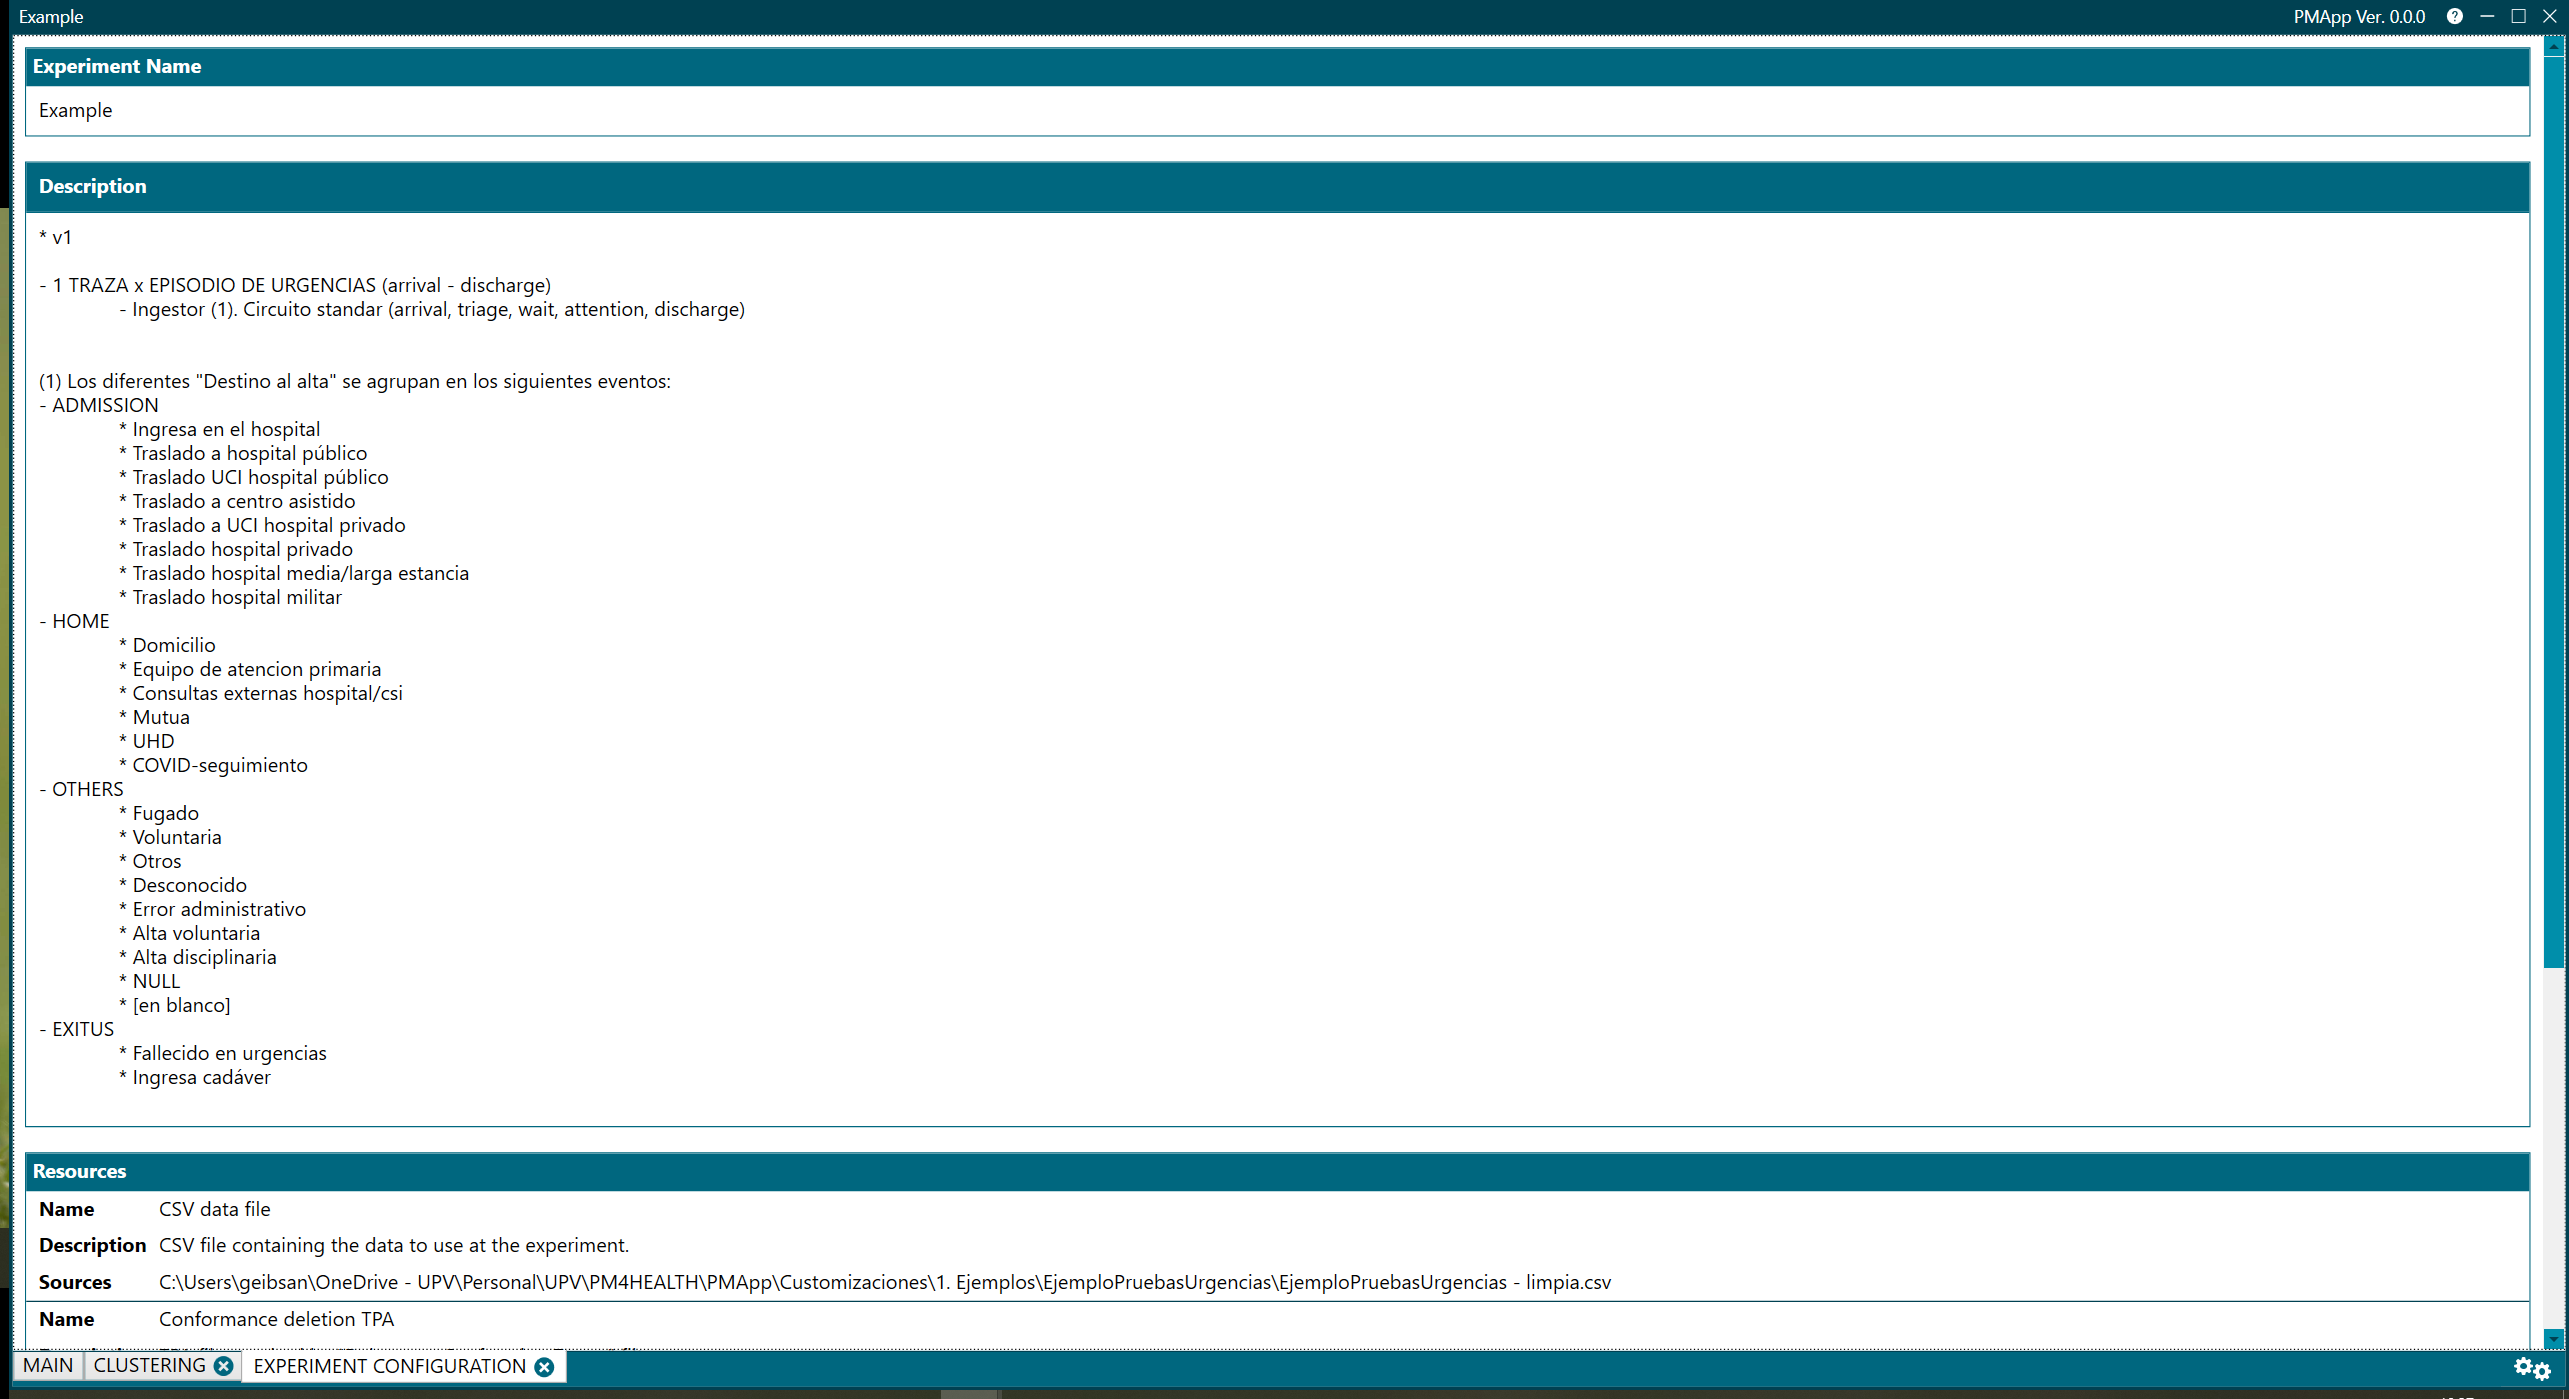
Figure 4. Experiment configuration
Transition information
This perspective displays information about transitions in the process view. For more information check Transition Information perspective.
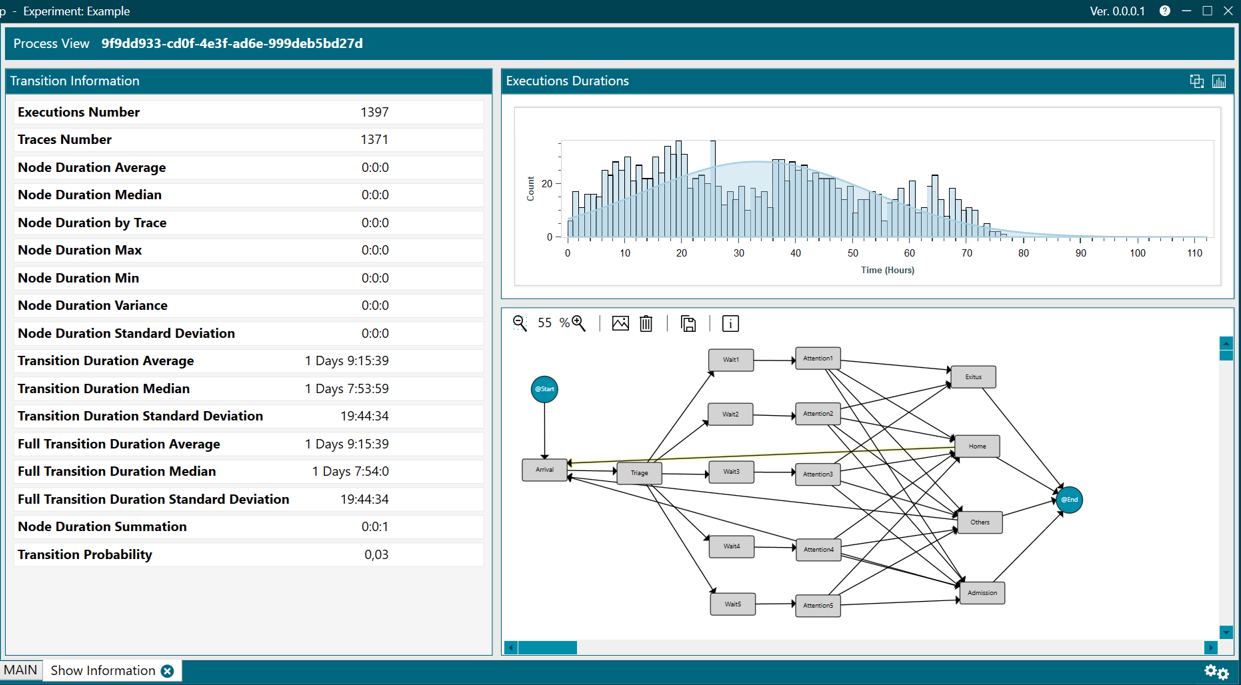
Figure 5. Transition Information
Node information
This perspective displays information about the nodes of a process view. For more information check Node Information perspective.
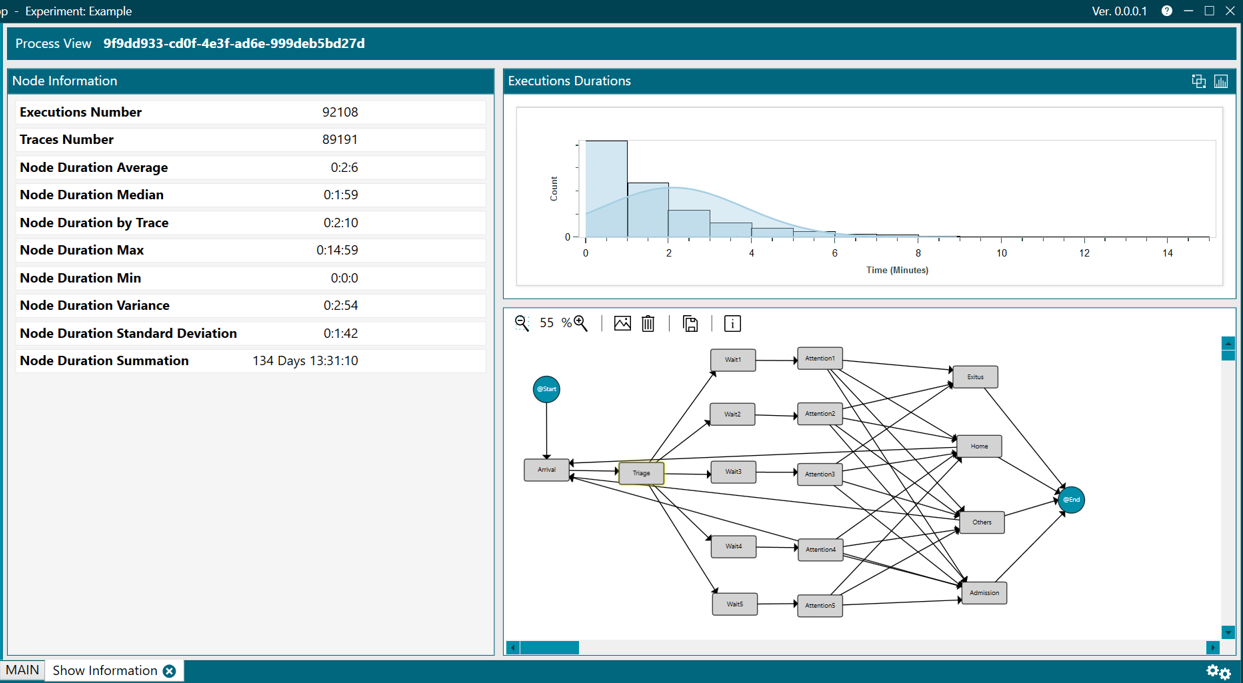
Figure 6. Node Information
Trace information
This perspective displays information about the traces of a process view. For more information check Trace Information perspective.
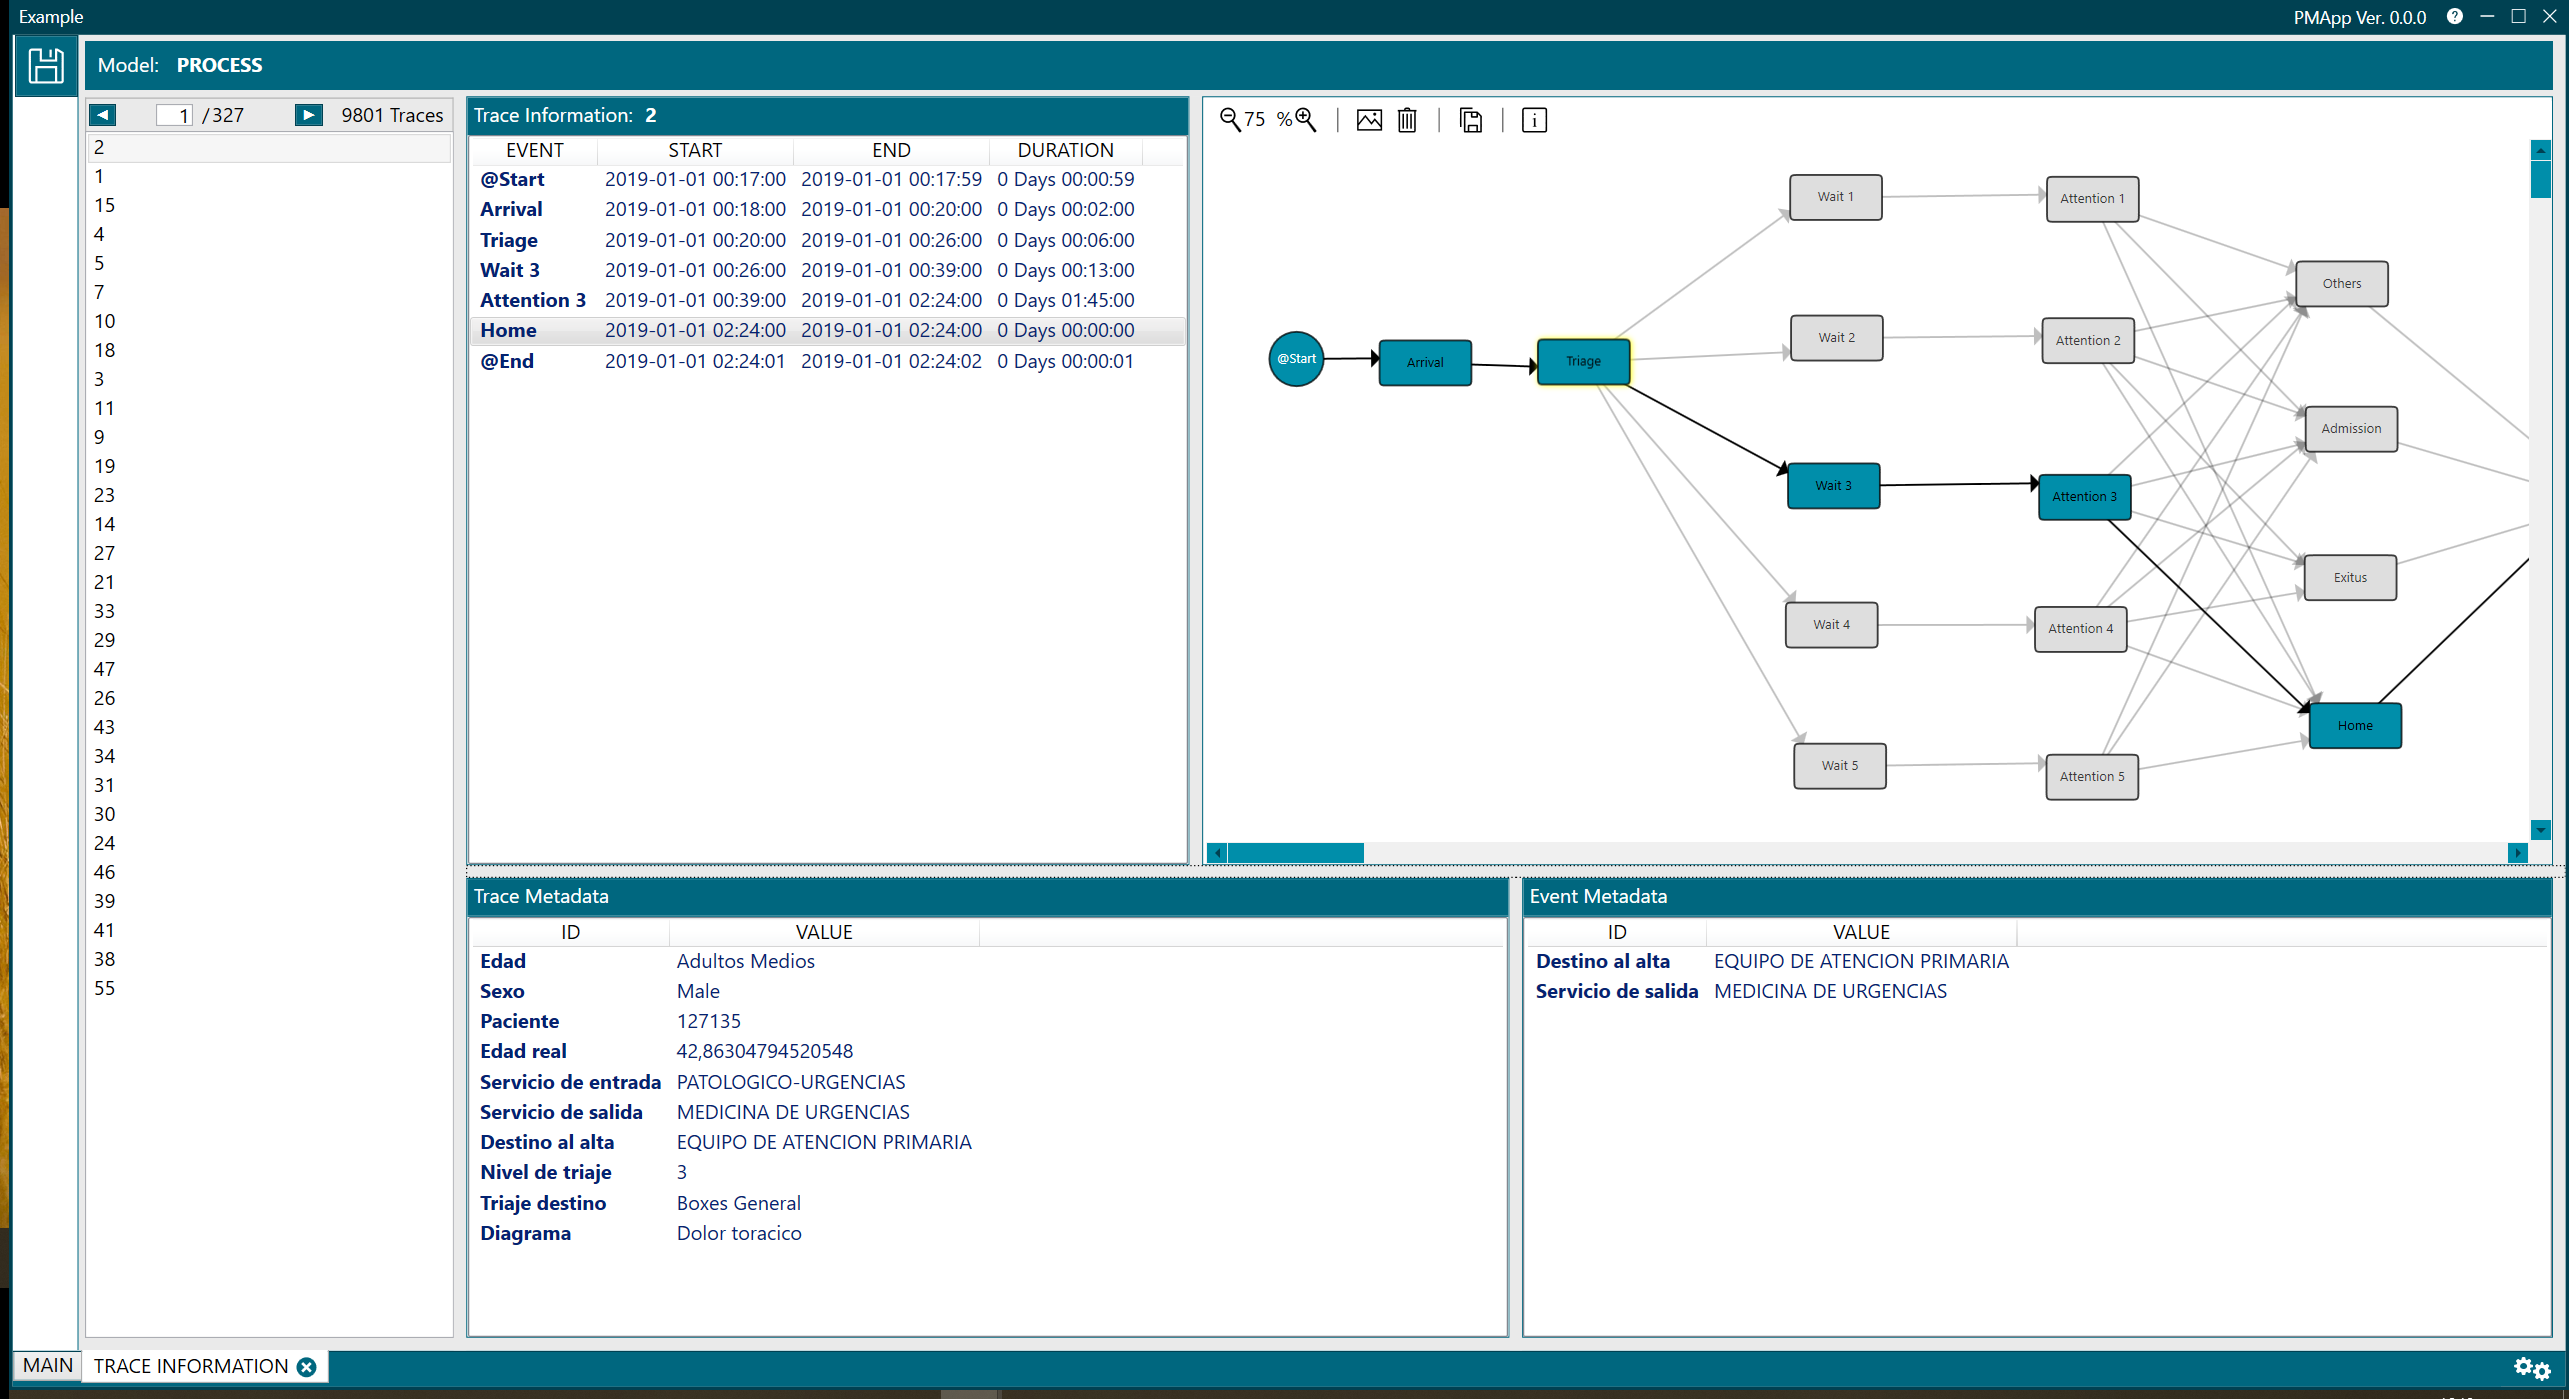
Figure 7. Trace Information
Clustering
This perspective finds similarities in data and generates different groups. It is useful when process views are complex and hard to understand (what is known as the spaghetti effect). For more information check Clustering perspective.
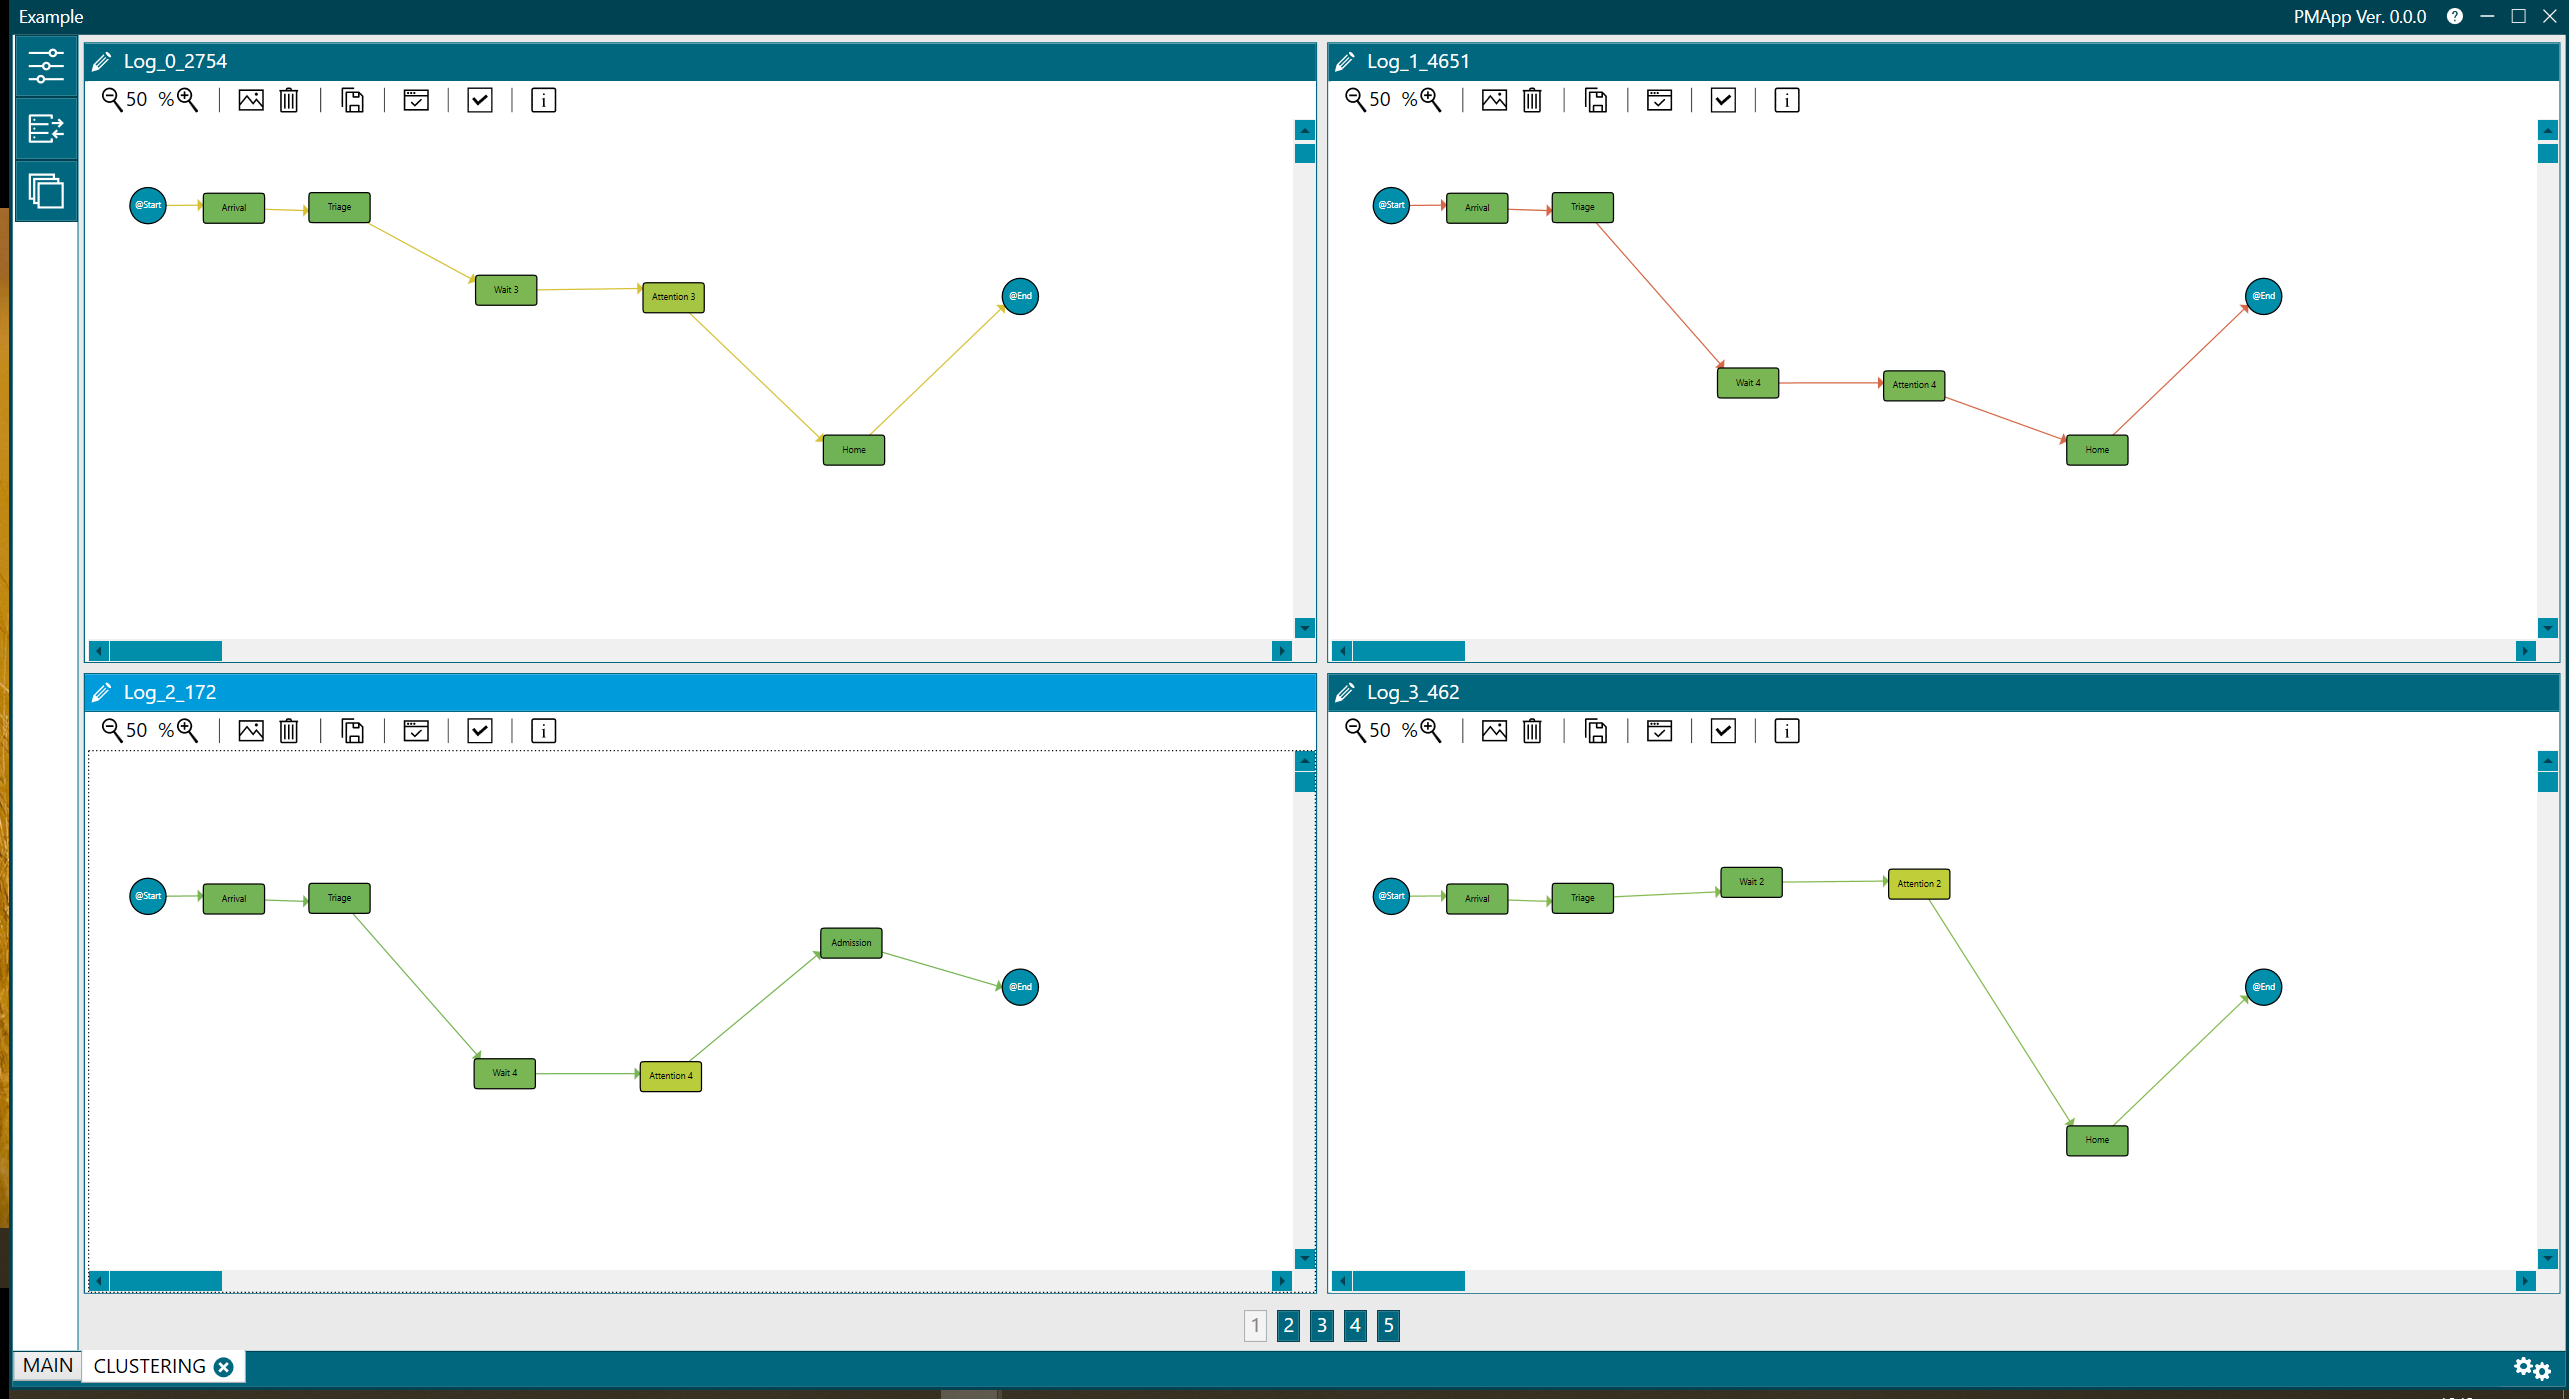
Figure 8. Clustering
For more information about each perspective check the Perspectives section.